[CONTENT]
$
USD
Total Economic Impact
Benefits And Cost Savings Enabled By The Snyk AI Trust Platform
A FORRESTER TOTAL ECONOMIC IMPACT STUDY COMMISSIONED BY Snyk, November 2025
Total Economic Impact
A FORRESTER TOTAL ECONOMIC IMPACT STUDY COMMISSIONED BY Snyk, November 2025


Snyk helps organizations’ developers and application security (AppSec) teams identify code vulnerabilities sooner and with less effort. It provides tools such as AI fix suggestions to remediate issues where they are, shifting application security left in the SDLC, avoiding remediation work, and accelerating organizations’ development of secure software that inherently improves security posture.
As AI code and third-party code continue to make up an increasing share of organizations’ code bases, security professionals and developers need the tools to secure this code — especially as application exploits remain top external attack vectors according to Forrester’s most recent Security Survey.1 By integrating and automating static application security testing (SAST) and software composition analysis (SCA) solutions early in software development lifecycles (SDLCs), organizations can establish rapid feedback loops for developers’ code, making it easier and more cost-effective to address issues. This approach not only minimizes unexpected tasks but also allows developers to concentrate on developing products.2
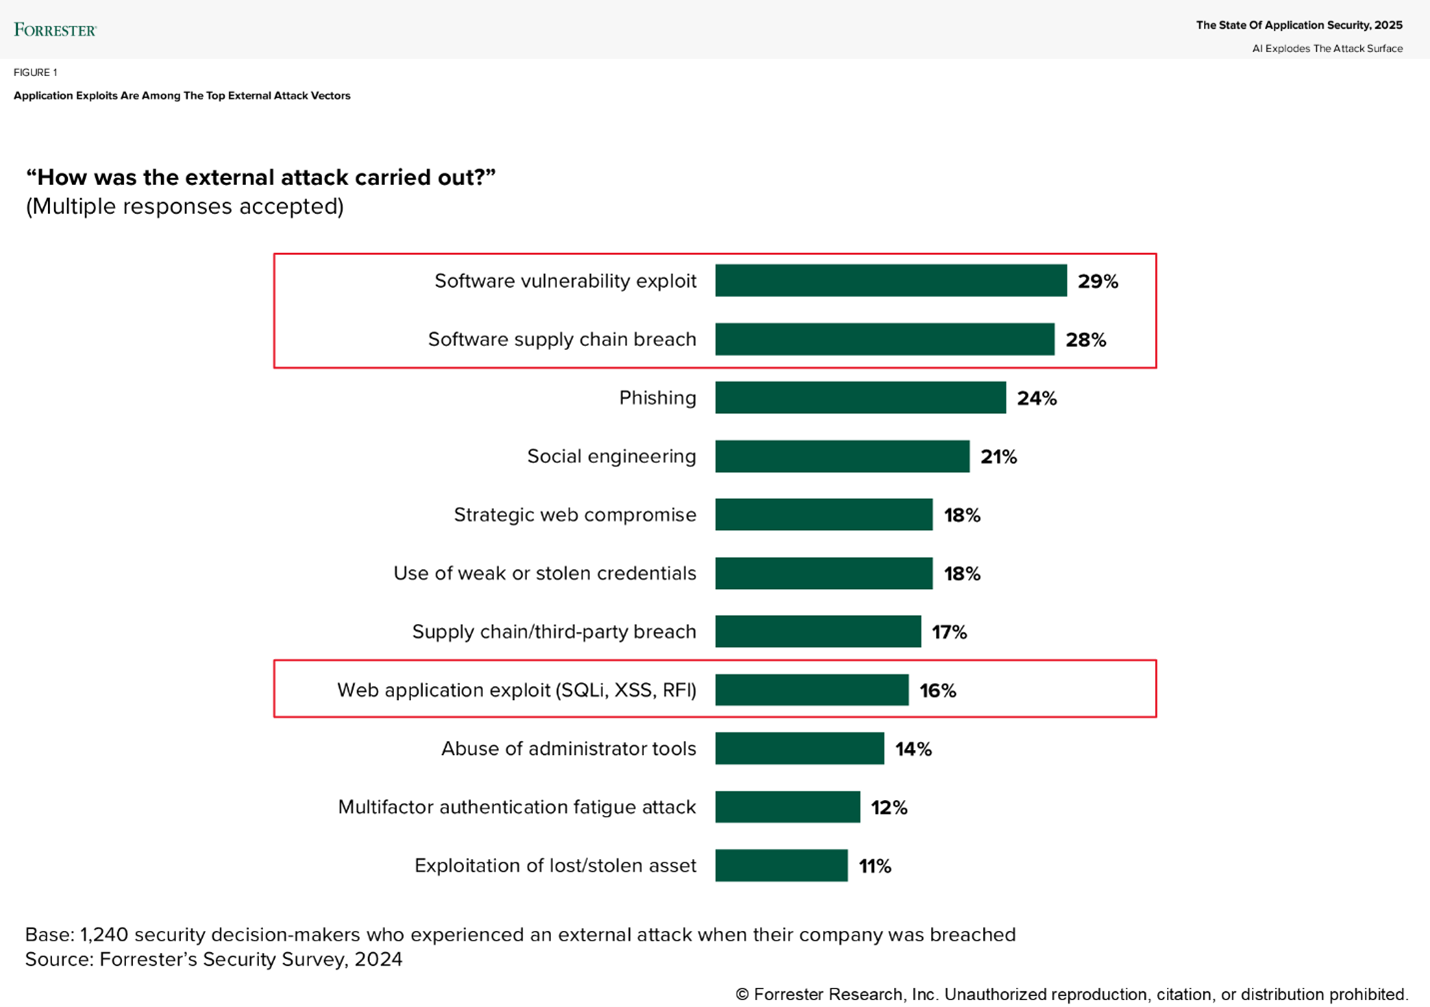
Note: Multiple responses accepted
Base: 1,240 security decision-makers who experienced an external attack when their company was breached
Source: Forrester’s Security Survey, 2024
Snyk commissioned Forrester Consulting to conduct a Total Economic Impact™ (TEI) study and examine the potential return on investment (ROI) enterprises may realize by deploying Snyk’s AI Trust Platform.3 The purpose of this study is to provide readers with a framework to evaluate the potential financial impact of Snyk on their organizations.
To better understand the benefits, costs, and risks associated with this investment, Forrester interviewed decision-makers across four organizations with experience using Snyk. For the purposes of this study, Forrester aggregated the experiences of the interviewees and combined the results into a single composite organization, which is an industry-agnostic organization with 2,500 developers and $15 billion annual revenue.
After the investment in Snyk’s AI Trust Platform, the interviewees’ organizations improved their previous scanning capabilities (spread across several disparate tools) at the repository, pipeline, integrated development environment (IDE), and container level. Using provided tools such as AI fix suggestions, developers could identify code vulnerabilities sooner and with less effort to remediate issues where they are; shift application security left in the SDLC; and avoid remediation work, retesting, and vulnerabilities — ultimately reducing the organizations’ security risk. Organizations also saved costs by consolidating AppSec functionality onto Snyk’s platform, and several interviewees noted direct cost savings on retired solutions that justified their Snyk deployment.
Quantified benefits. Three-year, risk-adjusted present value (PV) quantified benefits for the composite organization include:
Completing code vulnerability scans up to 80% faster, resulting in 84,000 hours reclaimed on slow scans. The composite organization improves its ability to scan code (internal and third-party) at the repository level, within development pipelines, and in development in the IDE, which provides real-time scanning and feedback to developers where they are and reduces the amount of effort required to identify vulnerabilities, prioritize action, and manage scanning across the SDLC.
Improving vulnerability remediation times by 60%, reclaiming 72,000 hours annually. Snyk’s AI-enabled fix suggestions within the developer interface result in less time spent fixing code and vulnerabilities for applications in production, which previously required exponentially more rework. High developer satisfaction with Snyk drives high adoption rates, contributing to this benefit.
Preventing the introduction of 10% of pre-Snyk vulnerabilities into runtime, avoiding 13,000 developer remediation hours. Snyk’s integration with the composite organization’s code repositories and development pipelines provides the ability to shift left, scanning code for vulnerabilities at the development process outset. This results not only in fewer vulnerabilities but also the ability to avoid them altogether by starting with vulnerability-free code.
Reducing mean-time-to-remediation (MTTR) by 52%, improving organizational security posture. By enabling developers to own security within application development processes with Snyk, the composite organization improves its organizational security posture and reduces the likelihood of critical security events that could result in damages, fines, and/or reputational damage.
Consolidating multiple AppSec solutions onto Snyk. The Snyk AI Trust Platform consolidates functionality previously dispersed across several AppSec solutions at the composite organization, enabling spending reduction and solution retirement. The composite organization consolidates four AppSec solutions onto Snyk.
Unquantified benefits. Benefits that provide value for the composite organization but are not quantified for this study include:
Accelerated SDLCs. With Snyk, the collective efficiencies provided to the organization’s developers culminate in faster SDLCs overall, enabling faster software release cycles and satisfying internal and external customers.
Developer upskilling and employee experience. Snyk provides the organization’s developers with features and functionality such as Snyk Learn and Snyk Agent that reduce time spent on manual work while also providing explanations and learning that upskill developers over time. With Snyk Learn, customers can target specific learning paths for common weakness enumeration types that are most problematic for certain applications and developer populations, systematically training around specific risks. High developer satisfaction and ease of use with Snyk contribute to significant adoption for these capabilities.
A secure development culture. A culture of secure application development takes hold across the composite organization’s development teams, fostering continued developer maturity for secure development when security may not have previously been a focus.
Snyk team support. Initial and ongoing support from the Snyk team is a major contributor to the high adoption and product successes achieved by the composite organization.
Costs. Three-year, risk-adjusted PV costs for the composite organization include:
Snyk licensing costs. The composite organization pays licensing fees to Snyk on a per developer and per platform configuration basis.
Implementation and ongoing management personnel costs. The composite organization dedicates personnel resources on an initial and ongoing basis to make its Snyk deployments and ongoing use successful.
The financial analysis that is based on the interviews found that a composite organization experiences benefits of $21.0 million over three years versus costs of $5.4 million, adding up to a net present value (NPV) of $15.5 million and an ROI of 288%.
Return on investment (ROI)
Benefits PV
Net present value (NPV)
Payback
| Role | Industry | Employees | Revenue (USD) |
|---|---|---|---|
| Manager, application code security | Banking | ~40,000 | ~$12 billion |
| AVP, data and application security | Insurance | ~35,000 | ~$46 billion |
| VP, product security and privacy | Media and telecommunications | ~182,000 | ~$125 billion |
| Director of software engineering | Technology | ~108,000 | ~$96 billion |
Interviewees noted how their organizations struggled with common challenges, including:
Securing all types of code, including AI-generated, on a single platform. Interviewees explained that before investing in Snyk, they either secured code of different origins (e.g., open-source code, custom-built code, AI-generated code) using different solutions or left it unsecured altogether. The AVP of data and application security at an insurance organization explained: “We had a [solution] that examined the security of open-source [code] that’s included in our applications, but we were not looking at vulnerabilities within the custom code that we wrote here. That was a gap that we needed to improve.” Other interviewees noted their limited adoption of AI coding, which could potentially deliver significant productivity benefits to developers, due to an inconsistent ability to secure it.
Multiple disparate AppSec solutions. As the needs of different development teams evolved, interviewees’ organizations tended to invest in different AppSec solutions across them independently, resulting in multiple expensive and redundant solutions that required management. The VP of product security and privacy at a media and telecommunications organization noted: “We were running multiple tools across different teams depending on their code base and technology stack. We would select tools that we thought were right for that specific team. It was a more manually intensive onboarding experience for the teams that didn’t scale to our needs anymore. We decided to move to a platform strategy with our [AppSec solutions].” The manager of application code security in the banking industry echoed: “Our developer community had three or four different [AppSec] tools to integrate into their pipelines, which was quite a bit of a nightmare. And there was no correlation between vulnerabilities found in one tool versus another. So there was a lot of frustration from the developers.”
Vulnerabilities in production and excessive developer remediation work. Interviewees noted that code vulnerabilities often made it into production without a means to scan code repositories and pipelines efficiently or plug into IDEs. As a result, teams often discovered security vulnerabilities after applications were in production, contributing to excessive developer remediation and rework. The AVP of data and application security in the insurance industry summarized, “Our developers were fighting fires backward from an existing problem versus preventing the problem to begin with.”
Ever-expanding vulnerability backlogs that exposed organizations to risk. Interviewees said that despite their developers’ efforts, the inability to effectively mitigate or avoid code vulnerabilities in production contributed to significant and ever-growing backlogs of known vulnerabilities that often took weeks to remediate. As MTTR metrics remained stagnant, the risks these vulnerabilities posed to their organizations remained present.
A suboptimal developer experience. Excessive remediation work, slow vulnerability scan times on previous solutions that often failed, and unclear workflows to remediate them contributed to developer fatigue. Incumbent tools to address these issues were often issue-specific and required training to use, creating additional friction in developer workflows for vulnerability identification and remediation.
The interviewees selected Snyk because it could:
Provide developers with an intuitive tool that required minimal training.
Greatly decrease code scanning times.
Provide concurrent coverage of code repositories, pipelines, open-source code, and containers on one platform.
Support a diverse set of coding languages.
Support security at inception for AI-generated code.
Shift security left, which helped diminish the number of vulnerabilities introduced over time, thereby reducing the backlog and saving previous remediation time.
Based on the interviews, Forrester constructed a TEI framework, a composite company, and an ROI analysis that illustrates the areas financially affected. The composite organization is representative of the interviewees’ organizations, and it is used to present the aggregate financial analysis in the next section. The composite organization has the following characteristics:
Description of composite. The composite organization is a global, $15 billion-dollar industry-agnostic organization with 35,000 employees. Of the organization’s personnel, 2,500 are developers responsible for creating and securing code and applications.
Deployment characteristics. The composite organization begins to adopt the full range of the Snyk AI Trust Platform in Year 1 of the analysis following a two-month implementation period. Initially, 80% of the composite organization’s developers leverage Snyk in their workflows, which grows to 95% of developers by Year 3 of the analysis. Before using Snyk, the composite organization maintained a collection of four AppSec solutions with now-redundant functionality on Snyk’s AI Trust Platform. Based on current developer capacity, they can address (e.g., remediate or prevent) an average of 21,600 open vulnerabilities with Snyk. A vulnerability requires 6.5 hours of developer time to remediate, averaged across all development stages.
$15 billion revenue
35,000 employees
2,500 developers
80% developer adoption rate (Year 1) expanding to 95% adoption rate (Year 3)
Full range of Snyk AI Trust Platform, including Snyk Agent Fix and Snyk Learn
| Ref. | Benefit | Year 1 | Year 2 | Year 3 | Total | Present Value |
|---|---|---|---|---|---|---|
| Atr | Developer productivity savings on scan times and vulnerability identification | $3,084,480 | $3,470,040 | $3,662,820 | $10,217,340 | $8,423,805 |
| Btr | Developer productivity savings on vulnerability remediation | $2,783,973 | $3,131,941 | $3,305,948 | $9,221,861 | $7,603,072 |
| Ctr | Developer productivity savings on vulnerability prevention | $515,549 | $579,992 | $612,214 | $1,707,755 | $1,407,979 |
| Dtr | Improved security posture | $647,817 | $728,794 | $769,283 | $2,145,894 | $1,769,208 |
| Etr | Cost savings on consolidated solutions | $675,000 | $720,000 | $765,000 | $2,160,000 | $1,783,434 |
| Total benefits (risk-adjusted) | $7,706,819 | $8,630,767 | $9,115,265 | $25,452,850 | $20,987,498 |
Evidence and data. Interviewees explained to Forrester that before implementing Snyk, identifying vulnerabilities in their organizations’ code was a cumbersome process that required ad hoc code scanning that consumed inordinate amounts of developer time. Some interviewees explained that although their organizations had incumbent scanning solutions, slow scan times and higher-than-desired failure rates and false positives didn’t meet the expectations of development teams and AppSec personnel. After implementing Snyk, interviewees collectively described an improved organizational ability to scan code (internal and third-party) at the repository level, within development pipelines, and in IDEs. This provided real-time scanning and feedback to developers where they were, reducing the amount of effort required to identify vulnerabilities and manage scanning.
The VP of product security and privacy at a media and telecommunications company explained that Snyk allowed scanning directly into repositories and within developer workflows on a single consolidated platform, thereby reducing the friction of scanning from the previous solution-heavy environment. The organization’s developers could identify and fix issues at scale faster than before as a result.
Frequent false positives without explanations to developers from other scanning solutions led to challenges implementing scanning into development processes. The director of software engineering at a technology organization explained: “[Our previous] developer tools for security had challenges like too many false positives and no feedback provided to the developers. We couldn’t integrate them well into our dev pipelines and our developer workflows. There was a lot of manual effort. And that’s where Snyk was able to come in and add value for our journey.” Overall, Snyk allowed their organization to provide zero-touch scanning across 6,000 developers at the repository level, saving a considerable amount of developer time.
Given the manual nature of some of the organizations’ scanning processes before Snyk, it may not have been in developers’ best interest to prioritize security. The director of software engineering at a technology organization summarized: “We could be sometimes looking at about two weeks to 30 days to get scan results back to developers. … The other solutions didn’t provide quick feedback for developers. Developers would initiate the scan, then would need to manually check whether their scan was successful, then see if there were vulnerabilities flagged in their code. It wasn’t in the developer’s best interest to go inspect those tools. They’d always say, ‘Hey, I’m busy with coding, I can’t prioritize this this unless we make it easier.’”
The AVP of data and application security at an insurance organization reiterated how Snyk’s automatic repository scans and real-time feedback for developers in the IDE contributed to significant developer time savings, explaining that developers could get all of their information in one place without checking several tools or running multiple scans.
Modeling and assumptions. For the composite organization, Forrester makes the following assumptions:
Eighty percent of the organization’s 2,500 developer staff adopt Snyk in Year 1, scaling to 95% of developers by Year 3 of the analysis.
Each developer spends an average of 3.5 hours per month on code scanning or vulnerability identification tasks before Snyk.
Using Snyk results in an 80% reduction in average code scanning times.
The average fully burdened hourly rate for developers is $72.
There is a 75% productivity recapture rate, as not all reclaimed time calculated for this benefit will be repurposed to value-adding activities.
Risks. This benefit will vary among organizations based on:
Former AppSec workflows and practices as they relate to the amount of time developers spend scanning code for vulnerabilities.
Incumbent application security solutions as they relate to the potential for improvement with Snyk.
The skill and capacity of an organization’s developers.
Developer adoption of Snyk within an organization.
Results. To account for these risks, Forrester adjusted this benefit downward by 15%, yielding a three-year, risk-adjusted total PV (discounted at 10%) of $8.4 million.
Average improvement on scan times
| Ref. | Metric | Source | Year 1 | Year 2 | Year 3 | |
|---|---|---|---|---|---|---|
| A1 | Total developers | Composite | 2,500 | 2,500 | 2,500 | |
| A2 | Snyk developer adoption | Composite | 80% | 90% | 95% | |
| A3 | Developer time spent scanning code pre-Snyk (hours per developer) | Composite (3.5 hours/month) | 42 | 42 | 42 | |
| A4 | Scan time reduction with Snyk | Interviews | 80% | 80% | 80% | |
| A5 | Developer time reclaimed on code scans (hours per developer) | A3*A4 | 33.6 | 33.6 | 33.6 | |
| A6 | Average fully burdened hourly rate for developers | Composite | $72 | $72 | $72 | |
| A7 | Productivity recapture | TEI methodology | 75% | 75% | 75% | |
| At | Developer productivity savings on scan times and vulnerability identification | A1*A2*A5*A6*A7 | $3,628,800 | $4,082,400 | $4,309,200 | |
| Risk adjustment | ↓15% | |||||
| Atr | Developer productivity savings on scan times and vulnerability identification (risk-adjusted) | $3,084,480 | $3,470,040 | $3,662,820 | ||
| Three-year total: $10,217,340 | Three-year present value: $8,423,805 | |||||
Evidence and data. Interviewees said that several efficiencies delivered to their organizations’ developer staff on the Snyk AI Trust Platform resulted in productivity savings while remediating vulnerabilities. Features on the platform, including Snyk Agent Fix and Snyk Assist, provided real-time remediation suggestions and feedback for developers securing code while writing it. Snyk Learn allowed developers to understand the context around the vulnerability. Interviewees said that with Snyk, their teams could easily remediate vulnerabilities flagged in production or already written into code in build pipelines without costly hours spent researching the vulnerability and its dependencies.
The director of software engineering at a technology organization estimated that their organization’s developers could remediate vulnerabilities an average of 56% faster with Snyk.
The developers at the media and telecommunications organization used Snyk Agent Fix to accelerate remediation efforts and development cycles automatically. The VP of product security and privacy concluded: “[Snyk Agent Fix] accelerates our fixes to code via some automated suggestions, which frees up developer cycles. It can pop up a tab and explain and recommend. The developer doesn’t have to go search for a fix.”
The manager of application code security said that faster identification of vulnerabilities among their bank’s code and applications provided faster feedback loops to developers during the development lifecycle, shifting application security work left and greatly reducing the amount of remediation work required of the developers overall. This interviewee estimated that SDLCs overall had accelerated by up to 20% by eliminating remediation work.
Given the high percentage of open-source code within the insurance organization’s code base, its developers were often fighting against new vulnerabilities after the fact given limitations of incumbent scanning tools. The AVP of data and application security explained that adopting Snyk and shifting left completely changed the developer workflow for application security: “Snyk’s ability to plug into the IDE and scan the repository is huge, as is the pipeline scan. These three things together gave us the ability to react to vulnerabilities before we put them into production. It’s obviously much less effort fixing the problem before it makes it through the testing cycles and that whole pipeline versus trying to react after.”
This same interviewee cited Snyk Agent Fix as one of the largest productivity enhancements for developers at their organization, as Snyk provided vulnerability context and suggested fixes to developers.
Modeling and assumptions. For the composite organization, Forrester makes the following assumptions:
Eighty percent of the organization’s developer staff adopt Snyk in Year 1, scaling to 95% of developers by Year 3 of the analysis.
Based on current developer capacity, using Snyk can help address 19,440 vulnerabilities annually.
Averaged across all stages of the development lifecycle, the average vulnerability takes 6.5 hours of developer time to remediate.
Fix suggestions provided by Snyk reduce remediation time per vulnerability by 60%, avoiding more than 70,000 developer hours annually by Year 3 of the analysis.
The average fully burdened hourly rate for developers is $72.
There is a 75% productivity recapture rate, as not all reclaimed time calculated for this benefit will be repurposed for value-adding activities.
Risks. This benefit will vary among organizations based on:
An organization’s pre-Snyk application security landscape as it relates to the number of existing vulnerabilities and the average remediation time per vulnerability.
Developer skill and capacity as they relate to the time available (and required) to remediate vulnerabilities.
Developer adoption of Snyk within an organization.
Results. To account for these risks, Forrester adjusted this benefit downward by 15%, yielding a three-year, risk-adjusted total PV (discounted at 10%) of $7.6 million.
Reduction in average vulnerability remediation times
| Ref. | Metric | Source | Year 1 | Year 2 | Year 3 | |
|---|---|---|---|---|---|---|
| B1 | Total vulnerabilities/issues remediated at current developer personnel capacity | Composite | 19,440 | 19,440 | 19,440 | |
| B2 | Snyk developer adoption | Composite | 80% | 90% | 95% | |
| B3 | Average time to remediate a vulnerability in runtime (hours) | Composite | 6.5 | 6.5 | 6.5 | |
| B4 | Total time to remediate vulnerabilities in runtime (hours) | B1*B2*B3 | 101,088 | 113,724 | 120,042 | |
| B5 | Reduction with Snyk (faster remediation of issues discovered in runtime) | Interviews | 60% | 60% | 60% | |
| B6 | Avoided developer remediation time (hours) | B4*B5 | 60,653 | 68,234 | 72,025 | |
| B7 | Average fully burdened hourly rate for developers | Composite | $72 | $72 | $72 | |
| B8 | Productivity recapture | TEI methodology | 75% | 75% | 75% | |
| Bt | Developer productivity savings on vulnerability remediation | B6*B7*B8 | $3,275,262 | $3,684,636 | $3,889,350 | |
| Risk adjustment | ↓15% | |||||
| Btr | Developer productivity savings on vulnerability remediation (risk-adjusted) | $2,783,973 | $3,131,941 | $3,305,948 | ||
| Three-year total: $9,221,861 | Three-year present value: $7,603,072 | |||||
Evidence and data. Interviewees noted that shifting application security left allowed their organization’s developers to identify and remediate vulnerabilities sooner, resulting in less time spent fixing code and vulnerabilities for applications in production that previously required exponentially more rework. Several interviewees stated that Snyk’s integration with their repositories and development pipelines allowed their teams to scan code for vulnerabilities sooner in the application development process than was previously possible, resulting in fewer vulnerabilities and the ability to avoid them altogether by starting with vulnerability-free code.
The technology organization prevents nearly 8,000 vulnerabilities annually with Snyk, resulting in avoided developer remediation effort. The director of software engineering explained that before Snyk, their organization could not fill its pipelines with instant scan feedback. With Snyk, they said: “Snyk’s IDE plugin is very intuitive, easy to run, and provides quick feedback. It will tell the development teams if there is a fix available or not and also prioritizes the vulnerabilities for the developer to remediate.”
By improving detection capabilities on the left of the development lifecycle, the AVP of data and application security in the insurance industry noted that with Snyk, they avoided almost all of the high and critical priority vulnerabilities from the start that would have previously made it into production, saving developer cycles while contributing to a better security posture for the organization.
Modeling and assumptions. For the composite organization, Forrester makes the following assumptions:
Eighty percent of the organization’s developer staff adopt Snyk in Year 1, scaling to 95% of developers by Year 3 of the analysis.
Snyk prevents 10% of the organization’s annual addressable vulnerabilities (starting development lifecycles with clean code scanned in the repository, etc.).
Averaged across all stages of the development lifecycle, the average vulnerability takes 6.5 hours of developer time to remediate.
Eliminating 2,160 vulnerabilities annually reclaims more than 13,000 developer hours by Year 3 of the analysis.
The average fully burdened hourly rate for developers is $72.
There is a 75% productivity recapture, as not all reclaimed time calculated for this benefit will be repurposed to value-adding activities.
Risks. This benefit will vary among organizations based on:
The pre-Snyk application security landscape at an organization as it relates to the number of avoidable vulnerabilities with Snyk.
The average vulnerability remediation time as it relates to the time reclaimable per avoided vulnerability.
Developer adoption of Snyk within an organization.
Results. To account for these risks, Forrester adjusted this benefit downward by 15%, yielding a three-year, risk-adjusted total PV (discounted at 10%) of $1.4 million.
Preventable vulnerabilities with Snyk
| Ref. | Metric | Source | Year 1 | Year 2 | Year 3 | |
|---|---|---|---|---|---|---|
| C1 | Preventable vulnerabilities with Snyk | 10% of 21,600 open vulnerabilities | 2,160 | 2,160 | 2,160 | |
| C2 | Snyk developer adoption | Composite | 80% | 90% | 95% | |
| C3 | Total time spent remediating vulnerabilities in runtime (hours) | Composite | 6.5 | 6.5 | 6.5 | |
| C4 | Developer time avoided on preventable vulnerabilities (hours) | C1*C2*C3 | 11,232 | 12,636 | 13,338 | |
| C5 | Average fully burdened hourly rate for developers | Composite | $72 | $72 | $72 | |
| C6 | Productivity recapture | TEI methodology | 75% | 75% | 75% | |
| Ct | Developer productivity savings on vulnerability prevention | C4*C5*C6 | $606,528 | $682,344 | $720,252 | |
| Risk adjustment | ↓15% | |||||
| Ctr | Developer productivity savings on vulnerability prevention (risk-adjusted) | $515,549 | $579,992 | $612,214 | ||
| Three-year total: $1,707,755 | Three-year present value: $1,407,979 | |||||
Evidence and data. Because Snyk enables developers to own security within application development processes, interviewees collectively described an improvement to organizational security posture. Over time, this improvement reduced the likelihood of critical security events that may result in damages, fines, and/or reputational damage. Interviewees also said that key metrics across the AppSec function, such as MTTR, open vulnerabilities, and net new vulnerabilities, had improved across the board. Some also noted that Snyk helped them prioritize remediation efforts based on vulnerability severity, further improving security posture.
Centralizing application security on Snyk allowed interviewees’ organizations to benchmark and set goals for application security to improve security posture over time. The VP of product security and privacy at the media and telecommunications organizations detailed tracking a decrease in vulnerability backlog, while the director of software engineering at the technology organization noted that MTTR for open vulnerabilities decreased by 55%, or 18 days, on average.
Several interviewees explained that deploying Snyk across their entire organization highlighted vulnerabilities that previously went undetected. The VP of product security and privacy at the media and telecommunications organization explained: “The good news is we now have full visibility everywhere, but the bad news is we have more than we knew that we needed to fix. From a security perspective, this good for company and for the cybersecurity organization.”
Interviewees noted that open-source or third-party code was starting to represent a significant portion of their organization’s code base, presenting security challenges before and after development. The director of software engineering at the technology organization reiterated that Snyk allowed their developer and security teams to become aware of issues in third-party code that would otherwise be missed, noting: “Because of Snyk, we now know that 80% or 90% of our vulnerabilities come from third parties. When we first rolled it out, developers didn’t even know some of these vulnerabilities existed. So Snyk allowed them to identify these during development, which was not the case before.”
Friction for developers using multiple scanning solutions across application security workflows resulted in some neglect (unintentional and intentional) at the bank. The manager of application code security concluded, “What code is scanned is now [AppSec leadership’s] decision rather than developers bypassing our controls and just deploying to production.”
Modeling and assumptions. For the composite organization, Forrester makes the following assumptions:
The cumulative cost of data breaches for the composite organization is $4.8 million, based on Forrester’s 2024 Security Survey.4
The likelihood of the composite organization experiencing one or more security breaches annually is 68%.5
Snyk can address 53% of the composite organization’s breach vectors, resulting in an average annualized risk exposure addressable with Snyk of $1.7 million.
The composite onboards 80% of its developer staff to Snyk in Year 1, scaling to 95% of developers by Year 3 of the analysis.
Snyk reduces the organization’s average annual risk exposure by 52% based on improvements to MTTR and reductions in new vulnerabilities introduced.
Risks. This benefit will vary among organizations based on:
An organization’s size and industry as they relate to the likelihood and costs associated with data breaches.
An organization’s pre-Snyk AppSec solutions and processes as they relate to the potential for improvements with Snyk.
Developer adoption of Snyk within an organization.
Results. To account for these risks, Forrester adjusted this benefit downward by 10%, yielding a three-year, risk-adjusted total PV (discounted at 10%) of $1.8 million.
Reduction in annualized risk exposure
| Ref. | Metric | Source | Year 1 | Year 2 | Year 3 | |
|---|---|---|---|---|---|---|
| D1 | Cumulative cost of breaches for the composite | Forrester research | $4,801,000 | $4,801,000 | $4,801,000 | |
| D2 | Likelihood of experiencing one or more breaches for the composite | Forrester research | 68% | 68% | 68% | |
| D3 | Percentage of breaches originating from vulnerabilities addressable by Snyk | Forrester research | 53% | 53% | 53% | |
| D4 | Annual risk exposure addressable with Snyk | D1*D2*D3 | $1,730,280 | $1,730,280 | $1,730,280 | |
| D5 | Reduced risk of exposure to breach costs from addressable attacks with Snyk | Interviews | 52% | 52% | 52% | |
| D6 | Snyk developer adoption | Composite | 80% | 90% | 95% | |
| Dt | Improved security posture | D4*D5*D6 | $719,797 | $809,771 | $854,759 | |
| Risk adjustment | ↓10% | |||||
| Dtr | Improved security posture (risk-adjusted) | $647,817 | $728,794 | $769,283 | ||
| Three-year total: $2,145,894 | Three-year present value: $1,769,208 | |||||
Evidence and data. Several interviewees explained to Forrester that the Snyk AI Trust Platform consolidated functionality previously dispersed across several application security solutions, allowing their organizations to reduce spending on and/or sunset these solutions.
The media and telecommunications organization consolidated all AppSec functionality on the Snyk AI Trust Platform, eliminating spending on three other solutions as a result. The VP of product security and privacy described the licensing cost savings as significant, but also highlighted additional support savings for these tools, noting, “There was also an engineering cost on our side to support these tools — to call the APIs, get metrics, troubleshoot, and support development teams on all these different tools.”
By consolidating three legacy AppSec solutions on Snyk, the manager of application code security at the bank highlighted direct license fee savings (a cost justifying the Snyk investment on these savings alone) and indirect management savings, explaining to Forrester: “All of our scanning tools were very power and resource hungry. A lot of our time was going into systems management. So moving to SaaS-based Snyk was an advantage.”
The insurance organization completely retired a legacy open-source AppSec solution after implementing Snyk with potentially more savings to come. The AVP of data and application security noted “massive savings potential” in retiring two more AppSec solutions, including a legacy container scanning solution.
Although their organization had yet to retire other AppSec tools since deploying Snyk, the director of software engineering at the technology organization expected that these savings would come as Snyk use continued to expand across their organization’s developer base.
Modeling and assumptions. For the composite organization, Forrester makes the following assumptions:
Four AppSec solutions averaging $250K per year in license fees contain now-redundant functionality with Snyk.
The composite can avoid 75% to 85% of this contract spend from Year 1 to Year 3 respectively, as Snyk adoption increases across the organization.
Risks. This benefit will vary among organizations based on:
The number of legacy AppSec solutions deployed at an organization and the average annual spend per solution.
Contractual stipulations that may affect an organization’s ability to reduce spending on legacy solutions.
Developer adoption of Snyk as it relates to the ability to sunset legacy solutions.
Results. To account for these risks, Forrester adjusted this benefit downward by 10%, yielding a three-year, risk-adjusted total PV (discounted at 10%) of $1.8 million.
Avoided spend on legacy AppSec solutions (Year 3)
| Ref. | Metric | Source | Year 1 | Year 2 | Year 3 | |
|---|---|---|---|---|---|---|
| E1 | AppSec solutions with redundant Snyk functionality | Composite | 4 | 4 | 4 | |
| E2 | Average annual expenditure per solution (licenses, maintenance) | Composite | $250,000 | $250,000 | $250,000 | |
| E3 | Avoided spend with Snyk | Interviews | 75% | 80% | 85% | |
| Et | Cost savings on consolidated solutions | E1*E2*E3 | $750,000 | $800,000 | $850,000 | |
| Risk adjustment | ↓10% | |||||
| Etr | Cost savings on consolidated solutions (risk-adjusted) | $675,000 | $720,000 | $765,000 | ||
| Three-year total: $2,160,000 | Three-year present value: $1,783,434 | |||||
Interviewees mentioned the following additional benefits that their organizations experienced but were not able to quantify:
Accelerated SDLCs. Interviewees explained that the collective efficiencies Snyk provided their organizations’ developers culminated in faster SDLCs overall, meaning faster delivery of new innovations and improvements to business-critical applications. By shifting application security left in development lifecycles, developers were less likely to spend inordinate amounts of time scanning for and remediating vulnerabilities, while Snyk Agent Fix and Assist enabled more secure and efficient AI coding. The manager of application code security in the banking industry explained that SDLCs as a whole had accelerated by reducing the previously frequent slowdowns with security vulnerabilities in production. As a result, they delivered internal and external applications to their customers faster than before. The AVP of data and application security at the insurance organization summarized: “If our developers don’t have to fix as many problems, they can focus more on delivering business value and solving for business problems versus trying to figure out, ‘How exactly do I remediate this vulnerability?’ or ‘Is this vulnerability even valid?’ The focus is now delivering a better product to the business.”
Developer upskilling and employee experience. Snyk provides an organization’s developers with features and functionality such as Snyk Learn and Snyk Agent that reduce time spent on tedious, manual work while also providing explanations and education that upskill developers over time. The VP of product security and privacy in the media and telecommunications industry noted that Snyk’s developer-focused interfaces significantly contributed to their decision to select Snyk over competitive offerings.
A secure development culture. Since deploying Snyk across their organizations, interviewees collectively noted that a culture of secure application development had taken hold across their development teams, fostering continued developer maturity for secure development. The VP of product security and privacy in the media and telecommunications industry summarized: “In our shift-left model, our developers better understand what they need to do versus having a security team tell them. Our developers are owning the responsibility themselves. They’re going to take more care in staying current on what they need to do.”
Snyk team support. Several interviewees credited support (initial and ongoing) from the Snyk team as a major contributor to the high adoption and successes they’d achieved. The AVP of data and application security at the insurance organization summarized: “Snyk has been engaged, really listening to us, solving any issues, and has really wonderful support for marketing new features. This engagement really helps us build energy around the product adoption within our company. They provided hands-on training as we were rolling out the product, and they’ve trained our entire developer community along the way. They’ve supported us on multiple learning sessions across all time zones and depths of knowledge.”
The value of flexibility is unique to each customer. There are multiple scenarios in which a customer might implement Snyk and later realize additional uses and business opportunities, including:
The future efficiencies and value of enabling AI coding. Interviewees explained to Forrester that the Snyk AI Trust Platform had and would continue to allow their developers to leverage secure AI coding techniques in their workflows, saving additional time while developing higher-quality code that may deliver additional value to their organizations over time. The interviewee at the insurance organization noted to Forrester that although adoption of AI coding and Snyk AI remediation suggestions at the company was high, there was still additional value to be had as more developers adopted these practices. At the bank, although current regulation prevented the use of AI in development, the manager of application code security noted that this would soon be up for review, potentially opening up this additional avenue for value.
Flexibility would also be quantified when evaluated as part of a specific project (described in more detail in Total Economic Impact Approach).
| Ref. | Cost | Initial | Year 1 | Year 2 | Year 3 | Total | Present Value |
|---|---|---|---|---|---|---|---|
| Ftr | Snyk licensing costs | $0 | $2,113,125 | $2,113,125 | $2,113,125 | $6,339,375 | $5,255,029 |
| Gtr | Implementation and ongoing management personnel costs | $33,000 | $50,160 | $50,160 | $50,160 | $183,480 | $157,740 |
| Total costs (risk-adjusted) | $33,000 | $2,163,285 | $2,163,285 | $2,163,285 | $6,522,855 | $5,412,769 |
Evidence and data. Organizations pay licensing fees to Snyk on a per developer and per platform configuration basis. Pricing will vary. For pricing specific for your organization please contact Snyk.
Modeling and assumptions. For the composite organization, Forrester makes the following assumptions:
The full range of the Snyk AI Trust Platform is contracted for 2,500 developers annually.
The annual cost to the composite organization based on these specifics is $2.0 million.
Risks. This cost will vary among organizations based on:
The number of users contracted for.
The specific configuration or Snyk features contracted for.
Results. To account for variances, Forrester adjusted this cost upward by 5%, yielding a three-year, risk-adjusted total PV (discounted at 10%) of $5.3 million.
| Ref. | Metric | Source | Initial | Year 1 | Year 2 | Year 3 |
|---|---|---|---|---|---|---|
| F1 | Snyk licensing costs for the composite organization | Composite | $2,012,500 | $2,012,500 | $2,012,500 | |
| Ft | Snyk licensing costs | F1 | $0 | $2,012,500 | $2,012,500 | $2,012,500 |
| Risk adjustment | ↑5% | |||||
| Ftr | Snyk licensing costs (risk-adjusted) | $0 | $2,113,125 | $2,113,125 | $2,113,125 | |
| Three-year total: $6,339,375 | Three-year present value: $5,255,029 | |||||
Evidence and data. Interviewees collectively described the initial and ongoing internal personnel effort required to make their Snyk adoptions and ongoing usage successful. On aggregate, they characterized their Snyk deployments as short- to mid-duration with great support from the Snyk team. Every interviewee noted that developer adoption, even across large developer populations, was extremely satisfactory, crediting the clear value that Snyk offered the developers within their current workflows.
The director of software engineering at the technology organization characterized a very smooth Snyk deployment in just over three months despite a significant developer base (more than 6,000 developers).
A eight-member team supported the Snyk implementation for the bank, integrating 16 large developer teams (6,000 developers and 1,200 applications) and their unique CI/CD pipelines in just under four months. Once deployed, managing Snyk became part-time work for a reduction of the same team.
The AVP of data and application security at the insurance organization credited their efficient Snyk adoption by more than 3,300 developers to activities built to drive awareness to some of Snyk’s developer-friendly features, including “bug bash” competitions and co-produced lunch-and-learns with the Snyk team.
Modeling and assumptions. For the composite organization, Forrester makes the following assumptions:
Six cross-functional implementation personnel spend 20% of their working time over the two-month Snyk implementation on activities supporting this deployment.
The average fully burdened annual salary for staff implementing Snyk is $150,000 ($12,500 per month, on average).
Once deployed, three AppSec professionals spend 10% of their working hours annually supporting the Snyk deployment.
The average fully burdened annual salary for AppSec personnel supporting Snyk is $152,000.
Risks. This cost will vary among organizations based on:
The scope and complexity of an organization’s Snyk deployment.
The skill and capacity of personnel implementing and supporting Snyk on an ongoing basis.
Results. To account for these variances, Forrester adjusted this cost upward by 10%, yielding a three-year, risk-adjusted total PV (discounted at 10%) of $158,000.
Snyk implementation duration
| Ref. | Metric | Source | Initial | Year 1 | Year 2 | Year 3 |
|---|---|---|---|---|---|---|
| G1 | Implementation personnel | Composite | 6 | |||
| G2 | Implementation duration (months) | Composite | 2 | |||
| G3 | Time spent on Snyk implementation tasks | Interviews | 20% | |||
| G4 | Fully burdened monthly rate for implementation personnel (rounded) | Composite | $12,500 | |||
| G5 | Subtotal: Implementation personnel costs | G1*G2*G3*G4 | $30,000 | |||
| G6 | Ongoing management personnel | Composite | 3 | 3 | 3 | |
| G7 | Time spent on ongoing Snyk-related tasks | Interviews | 10% | 10% | 10% | |
| G8 | Fully burdened annual salary for Snyk management personnel (rounded) | Composite | $152,000 | $152,000 | $152,000 | |
| G9 | Subtotal: Ongoing management personnel costs | G6*G7*G8 | $45,600 | $45,600 | $45,600 | |
| Gt | Implementation and ongoing management personnel costs | G5+G9 | $30,000 | $45,600 | $45,600 | $45,600 |
| Risk adjustment | ↑10% | |||||
| Gtr | Implementation and ongoing management personnel costs (risk-adjusted) | $33,000 | $50,160 | $50,160 | $50,160 | |
| Three-year total: $183,480 | Three-year present value: $157,740 | |||||
| Initial | Year 1 | Year 2 | Year 3 | Total | Present Value | |
|---|---|---|---|---|---|---|
| Total costs | ($33,000) | ($2,163,285) | ($2,163,285) | ($2,163,285) | ($6,522,855) | ($5,412,769) |
| Total benefits | $0 | $7,706,819 | $8,630,767 | $9,115,265 | $25,452,850 | $20,987,498 |
| Net benefits | ($33,000) | $5,543,534 | $6,467,482 | $6,951,980 | $18,929,995 | $15,574,729 |
| ROI | 288% | |||||
| Payback | <6 months |
The financial results calculated in the Benefits and Costs sections can be used to determine the ROI, NPV, and payback period for the composite organization’s investment. Forrester assumes a yearly discount rate of 10% for this analysis.
These risk-adjusted ROI, NPV, and payback period values are determined by applying risk-adjustment factors to the unadjusted results in each Benefit and Cost section.
The initial investment column contains costs incurred at “time 0” or at the beginning of Year 1 that are not discounted. All other cash flows are discounted using the discount rate at the end of the year. PV calculations are calculated for each total cost and benefit estimate. NPV calculations in the summary tables are the sum of the initial investment and the discounted cash flows in each year. Sums and present value calculations of the Total Benefits, Total Costs, and Cash Flow tables may not exactly add up, as some rounding may occur.
From the information provided in the interviews, Forrester constructed a Total Economic Impact™ framework for those organizations considering an investment in Snyk.
The objective of the framework is to identify the cost, benefit, flexibility, and risk factors that affect the investment decision. Forrester took a multistep approach to evaluate the impact that Snyk can have on an organization.
Interviewed Snyk stakeholders and Forrester analysts to gather data relative to Snyk’s AI Trust Platform.
Interviewed four decision-makers at organizations using Snyk to obtain data about costs, benefits, and risks.
Designed a composite organization based on characteristics of the interviewees’ organizations.
Constructed a financial model representative of the interviews using the TEI methodology and risk-adjusted the financial model based on issues and concerns of the interviewees.
Employed four fundamental elements of TEI in modeling the investment impact: benefits, costs, flexibility, and risks. Given the increasing sophistication of ROI analyses related to IT investments, Forrester’s TEI methodology provides a complete picture of the total economic impact of purchase decisions. Please see Appendix A for additional information on the TEI methodology.
Benefits represent the value the solution delivers to the business. The TEI methodology places equal weight on the measure of benefits and costs, allowing for a full examination of the solution’s effect on the entire organization.
Costs comprise all expenses necessary to deliver the proposed value, or benefits, of the solution. The methodology captures implementation and ongoing costs associated with the solution.
Flexibility represents the strategic value that can be obtained for some future additional investment building on top of the initial investment already made. The ability to capture that benefit has a PV that can be estimated.
Risks measure the uncertainty of benefit and cost estimates given: 1) the likelihood that estimates will meet original projections and 2) the likelihood that estimates will be tracked over time. TEI risk factors are based on “triangular distribution.”
The present or current value of (discounted) cost and benefit estimates given at an interest rate (the discount rate). The PV of costs and benefits feed into the total NPV of cash flows.
The present or current value of (discounted) future net cash flows given an interest rate (the discount rate). A positive project NPV normally indicates that the investment should be made unless other projects have higher NPVs.
A project’s expected return in percentage terms. ROI is calculated by dividing net benefits (benefits less costs) by costs.
The interest rate used in cash flow analysis to take into account the time value of money. Organizations typically use discount rates between 8% and 16%. This analysis uses a discount rate of 10%.
The breakeven point for an investment. This is the point in time at which net benefits (benefits minus costs) equal initial investment or cost.
Total Economic Impact is a methodology developed by Forrester Research that enhances a company’s technology decision-making processes and assists solution providers in communicating their value proposition to clients. The TEI methodology helps companies demonstrate, justify, and realize the tangible value of business and technology initiatives to both senior management and other key stakeholders.
Related Forrester Research
The Static Application Security Testing Solutions Landscape, Q2 2025, Forrester Research, Inc., May 8, 2025.
The State of Application Security, 2025, Forrester Research, Inc., May 9, 2025.
1 Source: The State of Application Security, 2025, Forrester Research, Inc., May 9, 2025.
2 Source: The Static Application Security Testing Solutions Landscape, Q2 2025, Forrester Research, Inc., May 8, 2025.
3 Total Economic Impact is a methodology developed by Forrester Research that enhances a company’s technology decision-making processes and assists solution providers in communicating their value proposition to clients. The TEI methodology helps companies demonstrate, justify, and realize the tangible value of business and technology initiatives to both senior management and other key stakeholders.
4 Source: Forrester’s Security Survey, 2024. This study analyzes broad patterns among security decision-makers across multiple areas related to an organization’s cybersecurity practices. While this study primarily provides insight into the priorities, investments, and customer journeys of decision-makers, it also includes questions about general priorities as well as standard demographic and firmographic questions. Forrester annually assesses cybersecurity metrics through interviews, surveys, and expertise in the field.
5 Ibid.
Readers should be aware of the following:
This study is commissioned by Snyk and delivered by Forrester Consulting. It is not meant to be used as a competitive analysis.
Forrester makes no assumptions as to the potential ROI that other organizations will receive. Forrester strongly advises that readers use their own estimates within the framework provided in the study to determine the appropriateness of an investment in Snyk. Forrester does not endorse Snyk or its offerings. Although great care has been taken to ensure the accuracy and completeness of this model, Snyk and Forrester Research are unable to accept any legal responsibility for any actions taken on the basis of the information contained herein.
Snyk reviewed and provided feedback to Forrester, but Forrester maintains editorial control over the study and its findings and does not accept changes to the study that contradict Forrester’s findings or obscure the meaning of the study.
Snyk provided the customer names for the interviews but did not participate in the interviews.
Richard Cavallaro
November 2025
ABOUT FORRESTER CONSULTING
Forrester provides independent and objective research-based consulting to help leaders deliver key transformation outcomes. Fueled by our customer-obsessed research, Forrester’s seasoned consultants partner with leaders to execute on their priorities using a unique engagement model that tailors to diverse needs and ensures lasting impact. For more information, visit forrester.com/consulting.
© Forrester Research, Inc. All rights reserved. Unauthorized reproduction is strictly prohibited. Information is based on best available resources. Opinions reflect judgment at the time and are subject to change. Forrester®, Technographics®, Forrester Wave, and Total Economic Impact are trademarks of Forrester Research, Inc. All other trademarks are the property of their respective companies.
https://mainstayadvisor.com/go/mainstay/gdpr/policy.html