



Executive Summary
As organizations accelerate digital engagement, expand connected ecosystems, and prepare for AI-driven interactions, it has become increasingly difficult to deliver seamless user experiences while maintaining strong security, compliance, and fraud prevention. Identity has become the control point for these interactions — governing how employees, customers, partners, and nonhuman identities access systems, data, and services across digital channels. Organizations must automate core identity and access management (IAM) functions to prevent data breaches, meet regulatory requirements, maintain employee productivity, and support business growth.1
Ping Identity provides a unified identity platform to manage, secure, and govern access for all identity types — including customers, workforce users, partners, and nonhuman identities such as service accounts, machine identities, and AI agents — across cloud, on-premises, and hybrid environments. The platform addresses fragmented identity infrastructures, security and fraud risk, and inconsistent digital experiences by centralizing identity verification, authentication, access management, orchestration, and governance. By doing so, it can enable organizations to deliver secure, low-friction digital experiences, reduce risk, and support scalable, trusted interactions across touchpoints.
Ping Identity commissioned Forrester Consulting to conduct a Total Economic Impact™ (TEI) study and examine the return on investment (ROI) enterprises may realize by deploying Ping Identity.2 The purpose of this study is to provide readers with a framework to evaluate the potential financial impact of Ping Identity on their organizations.
To better understand the benefits, costs, and risks associated with this investment, Forrester interviewed eight decision-makers with experience using Ping Identity. For the purposes of this study, Forrester aggregated the experiences of the interviewees and combined the results into a single composite organization, which is a global organization with $5 billion in annual revenue and 100,000 employees.
Interviewees said that prior to using Ping Identity, their organizations operated fragmented identity environments built on legacy tools, homegrown solutions, and multiple identity providers. Attempts to modernize through incremental fixes or point solutions delivered limited success, leaving teams with complex, hard‑to‑scale identity processes that increased operational effort, security risk, and technical debt.
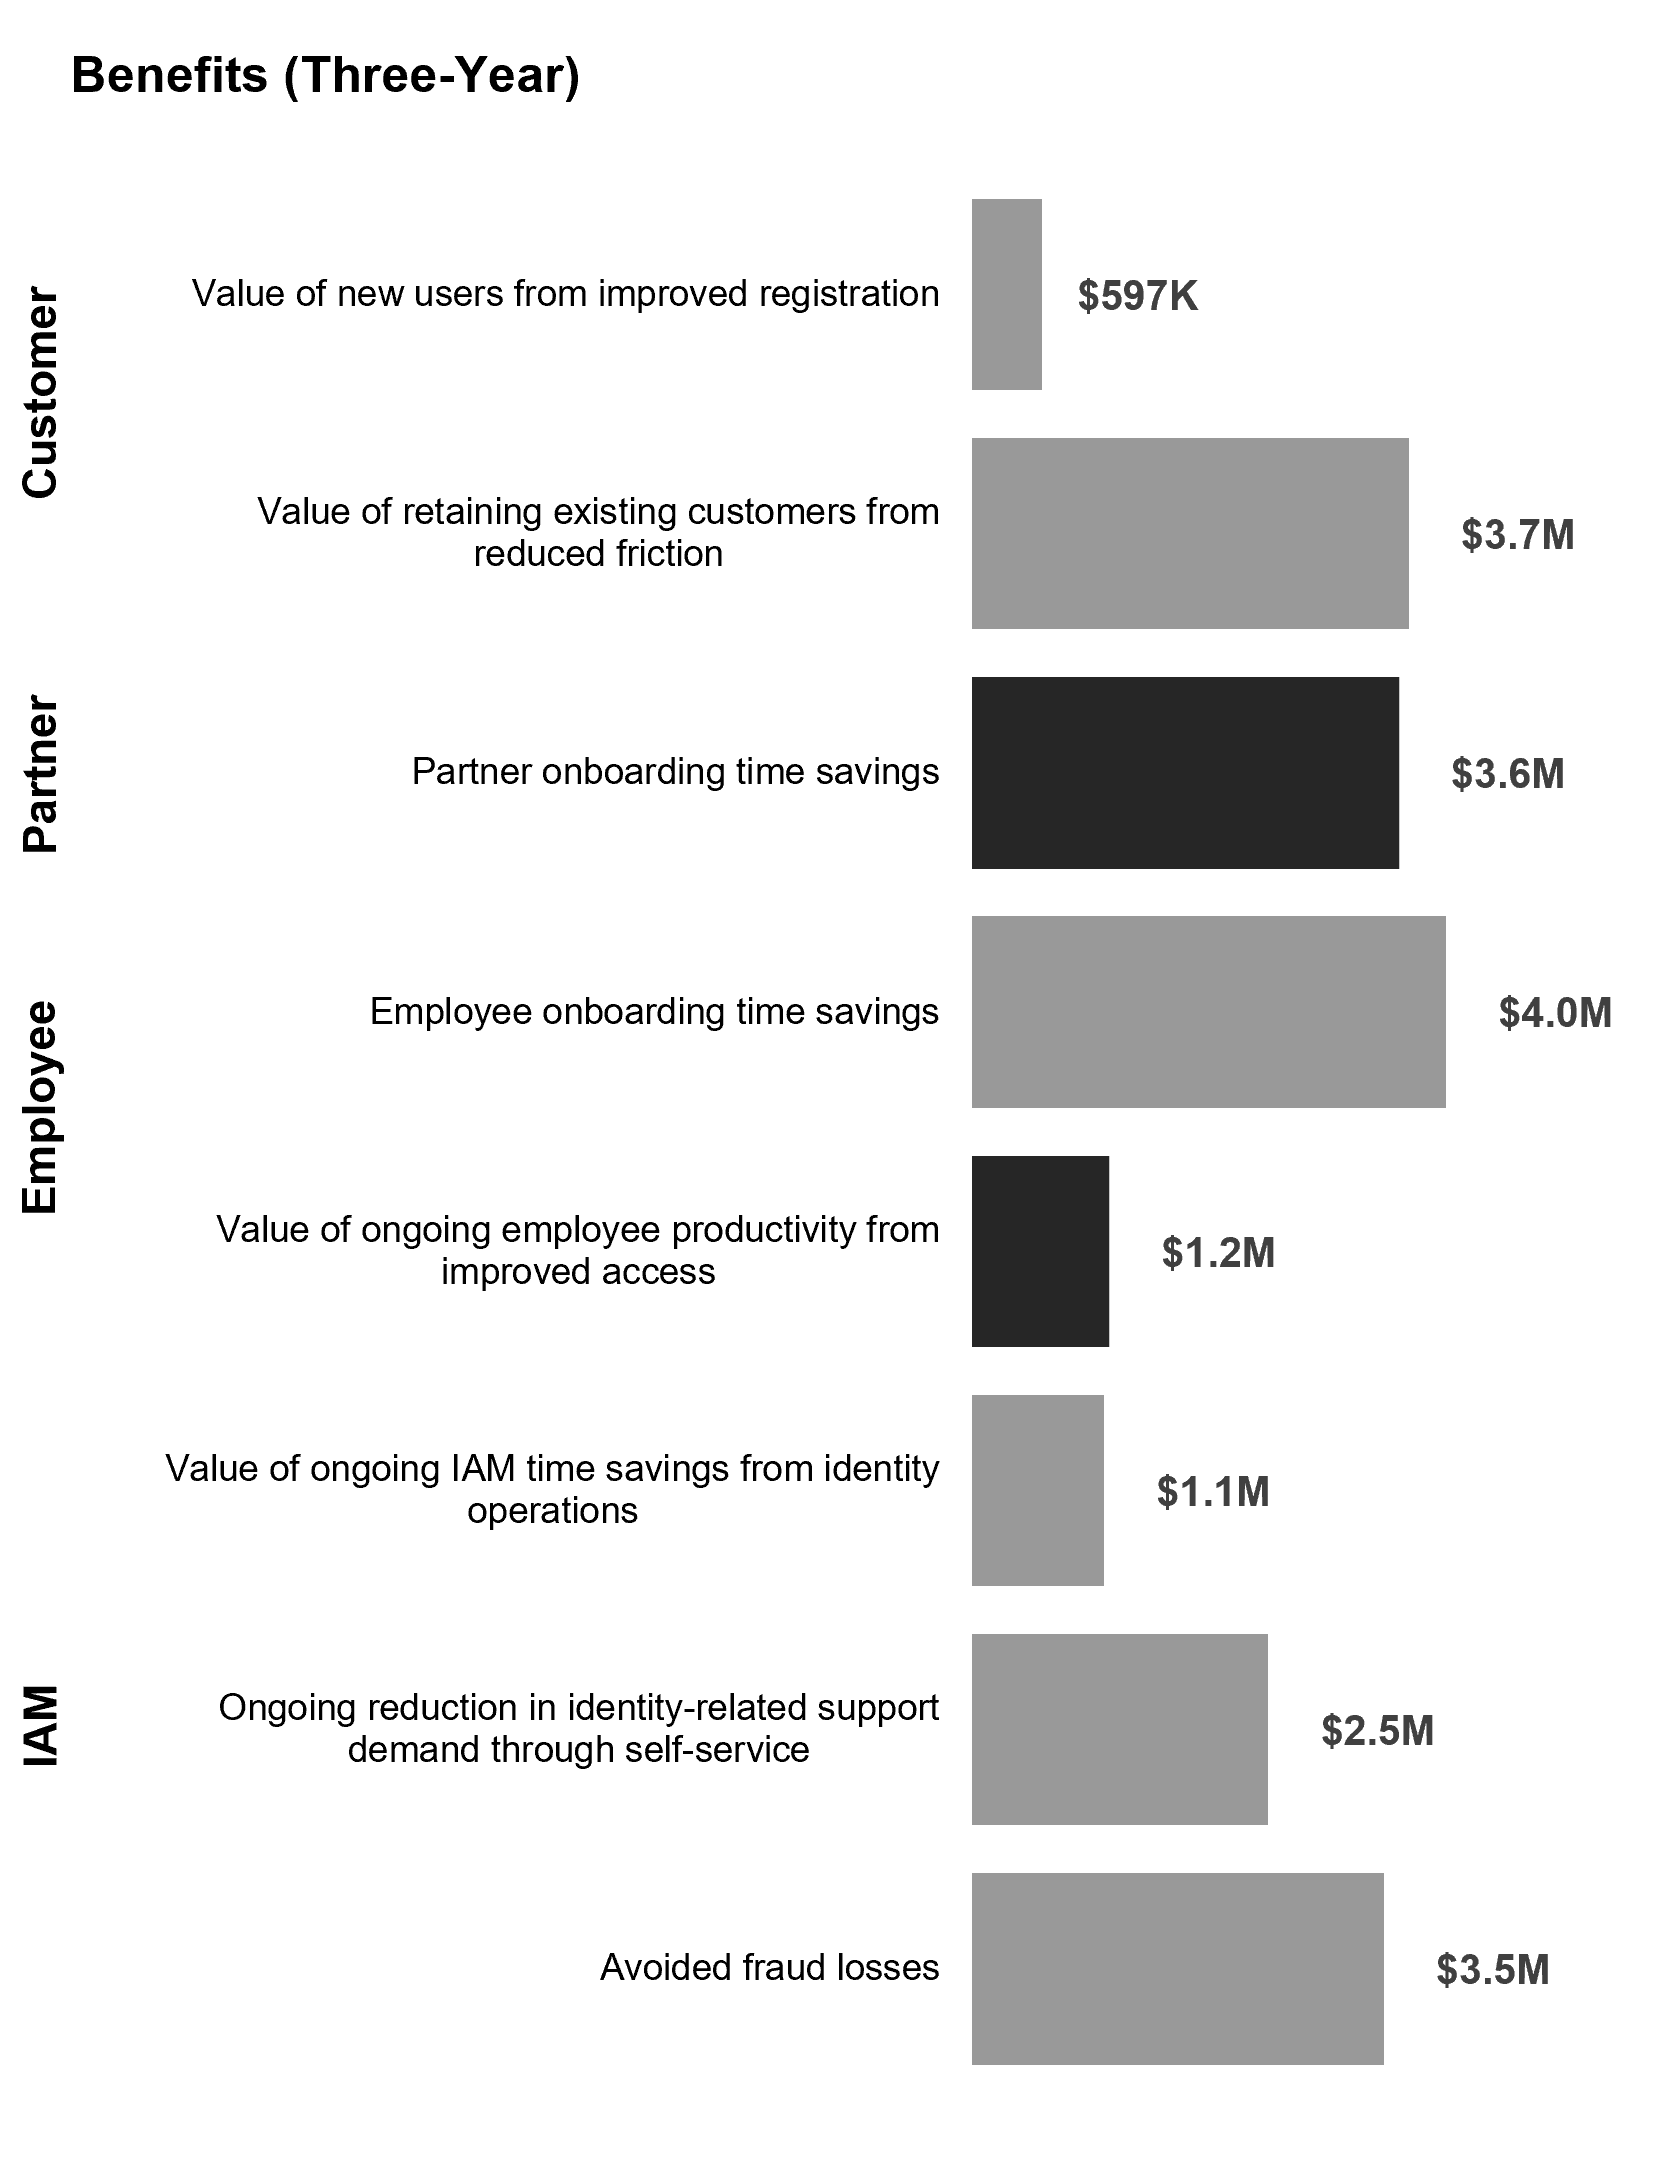
After the investment in Ping Identity, interviewees described moving to a more unified and scalable identity platform that centralized authentication, access management, and orchestration across use cases. This shift improved identity reliability and performance at scale, reduced operational complexity through consolidation and automation, and strengthened security controls, while reducing friction for end users. These improvements generated value across customer acquisition and retention, workforce productivity, IAM operational efficiency, partner enablement, and fraud reduction, resulting in $20.3 million in risk-adjusted benefits, a net present value (NPV) of $15.5 million, and a 325% ROI over three years.
Key Findings
Quantified benefits. Three-year, risk-adjusted present value (PV) quantified benefits for the composite organization include:
-
Increasing successful new user registrations by 5 percentage points. The composite organization reduces friction during signup and authentication, enabling more prospective users to complete registration successfully. Previously, authentication failures and complex registration flows caused users to abandon onboarding or create duplicate accounts. With Ping Identity, improved authentication reliability and streamlined registration journeys result in more new paid users without additional marketing spend. This improvement drives incremental revenue while improving the efficiency of digital acquisition efforts.
-
Increasing customer retention by 0.5 percentage points. The composite organization improves customer retention by reducing login friction, account lockouts, and authentication failures for returning users. Before Ping Identity, inconsistent authentication experiences and legacy security controls created frustration that contributed to customer disengagement. With Ping Identity, improved reliability, stronger multifactor authentication (MFA), and simplified access help customers remain engaged with digital channels and services over time. These gains translate into sustained revenue from existing customers and strengthen trust and engagement across digital channels.
-
Reducing partner onboarding effort by 90%. The composite organization accelerates partner onboarding by standardizing identity workflows and automating provisioning. Previously, onboarding required extensive manual configuration, custom integrations, and coordination across teams, often taking weeks to complete. With Ping Identity, onboarding becomes faster and more efficient, enabling partners to begin transacting sooner without extensive administrative effort. These improvements accelerate partner enablement and reduce time to activate new business relationships and integrations.
-
Reducing employee onboarding effort by 80%. Ping Identity streamlines access provisioning for the composite through standardized identity workflows and automation, accelerating time to productivity for new hires. Before Ping Identity, provisioning access across applications required significant manual effort and coordination. With standardized identity workflows and automation, new hires obtain access more quickly while identity and IT teams spend less time managing provisioning activities. These gains accelerate time to productivity for new hires while reducing provisioning complexity for identity and IT teams.
-
Improving employee login success and recovery time by 20%. The composite organization improves employee productivity by reducing failed logins, password resets, and account lockouts. With Ping Identity, improved access reliability and faster recovery minimize disruptions caused by authentication issues, allowing employees to remain focused on value-added work and maintain productivity throughout the day.
-
Redirecting 20% of IAM team capacity to higher-value work. The composite organization improves IAM team efficiency by consolidating identity platforms and reducing manual administration. With Ping Identity, identity teams spend less time maintaining fragmented systems and routine operational processes, allowing greater focus on governance, security improvements, and strategic initiatives. This shift enables identity teams to focus less on day-to-day operations and more on driving strategic security and business outcomes.
-
Reducing identity-related support demand by 90% through self-service. The composite organization reduces authentication friction and identity-related support volumes by enabling self-service capabilities such as password reset, MFA enrollment, and account recovery. Before modernization with Ping Identity, authentication issues generated high support volumes and required significant manual intervention. With self-service options in place, users can resolve many common authentication issues independently, lowering support labor costs and allowing help desk resources to focus on higher-value activities.
-
Reducing account takeover-related fraud losses by 25%. Ping Identity strengthens the composite’s authentication controls, expands MFA adoption, and centralizes identity management across applications, reducing fragmented authentication surfaces and enabling more consistent monitoring and policy enforcement across the identity lifecycle. These improvements reduce the likelihood of compromised credentials and unauthorized access while strengthening the organization's overall identity-driven security posture.
Unquantified benefits. Benefits that provide value for the composite organization but are not quantified for this study include:
-
Greater confidence in enterprise security and compliance posture at scale. By establishing more consistent identity controls and governance, the composite improves audit readiness, supports regulatory compliance, strengthens data protection, and reduces operational risk across the organization.
-
Improved ongoing partner management, relationships, and efficiency. By centralizing identity and standardizing access management, the composite reduces friction in maintaining partner access and supporting cross-application interactions after onboarding. These improvements enable its partners to become active more quickly and support more consistent partner engagement over time.
-
Improved resiliency and speed to response for identity-related security events. The composite centralizes identity and reduces fragmented attack surfaces, which improves visibility into identity activity and enables faster detection and response to potential security issues. These capabilities allow it to identify and prioritize threats more quickly, isolate impacted accounts, and reduce remediation time, strengthening overall operational resilience.
-
Improved organizational ownership and governance of identity capabilities. Stronger internal control over identity strategy and execution emerges as the composite moves away from heavily customized or third-party-managed identity environments. This shift enables clearer accountability, improved cross-team coordination, and more proactive planning for identity-dependent initiatives.
-
Reduced long-term architectural complexity and technical debt. Consolidating fragmented identity tools and retiring legacy systems reduces the composite’s technical debt and simplifies its identity architecture. This reduction in complexity improves system stability, lowers future operational risk, and supports long-term modernization efforts.
Costs. Three-year, risk-adjusted PV costs for the composite organization include:
-
Implementation and setup, totaling $1.6 million. The composite organization makes a one-time implementation investment in Year 0 to deploy and integrate Ping Identity across workforce and customer identity use cases. Implementation costs reflect the scale and complexity of a large enterprise identity environment, including millions of identities and thousands of applications, and are consistent with a consolidation and replacement of fragmented legacy identity systems rather than an incremental upgrade.
-
Annual software subscription costs, totaling $2.5 million over three years. The composite organization incurs recurring subscription fees to license Ping Identity across its identity populations and application environment. These costs reflect ongoing access to authentication, access management, orchestration, and security capabilities, and remain consistent over the three-year analysis period as the organization operates the platform in a steady-state environment.
-
Ongoing labor and governance, totaling $630,000 over three years. The composite organization maintains a small internal team responsible for administering and governing the identity platform following deployment. These resources support ongoing configuration, user and access management, and operational oversight, reflecting steady-state requirements after implementation is complete.
The financial analysis that is based on the interviews found that a composite organization experiences benefits of $20.3 million over three years versus costs of $4.8 million, adding up to a net present value (NPV) of $15.5 million and an ROI of 325%.
Key Statistics
$20.3M
Benefits PV
$15.5M
Net present value (NPV)
325%
Return on investment (ROI)
<6 months
Payback
Benefits (Three-Year)
The Ping Identity Customer Journey
Drivers leading to the Ping Identity investment
Interviews
| Role | Industry | Headquarters | Geographic Focus | Revenue | Employees |
|---|---|---|---|---|---|
| CISO | Insurance | United States | United States and Asia | $17B | 30,000 |
| Director of information security | Pharmaceutical | United Kingdom | Global | $43B | 120,000 |
| Technical delivery manager | Financial services | United Kingdom | United Kingdom | $0.5B | 1,800 |
| VP of information security | Travel and hospitality | United States | North America, Europe, and Asia-Pacific | $5B | 25,000 |
| CISO | Business services | United States | United States and Europe | $6B | 20,000 |
| Head of customer IAM | Transportation | United States | Global | $59B | 113,000 |
| Director of security engineering | Financial services | United States | United States, limited global | $84B | 250,000 |
| Principal enterprise technology engineer | Energy, oil, and gas | Singapore | Southeast Asia | $189B | 100,000 |
Key Challenges
Prior to investing in a modern identity platform, interviewees’ organizations relied on a mix of legacy commercial tools, homegrown authentication services, and third‑party-managed IAM platforms. These environments were often tightly coupled with applications, difficult to change, and increasingly misaligned with modern security, compliance, and digital experience requirements. As a result, identity became a constraint on scalability, security posture, and speed to market rather than an enabler.
Interviewees noted how their organizations struggled with common challenges, including:
-
Fragmented and brittle identity stacks increased operational risk.
Organizations relied on multiple legacy and homegrown IAM components spanning workforce, customer, and partner use cases, often with inconsistent policies and duplicated logic. This fragmentation created fragile architectures that were difficult to maintain and heightened the risk of outages, security gaps, and integration failures as environments scaled.
-
Legacy platforms were expensive and slow to change. Several interviewees described identity platforms that required months or even years to upgrade, with changes and downstream applications that were tightly coupled. Small adjustments to authentication journeys or policies required significant effort from internal teams or managed service providers, limiting their organizations’ ability to respond quickly to business or regulatory needs.
-
Security and compliance gaps created material risk exposure. Prior identity approaches included clear‑text passwords, limited or inconsistent MFA adoption, and insufficient encryption or policy enforcement. For regulated organizations, this created ongoing concerns with auditability, data protection, and adherence to internal and external security standards, increasing operational and reputational risk.
-
Poor authentication experiences drove high support volumes and user friction. Inefficient login, registration, and password‑reset processes resulted in elevated call center and help desk volumes, particularly for customer‑facing use cases. In some cases, users abandoned digital channels or created duplicate accounts when authentication failed, adding cost and degrading the overall customer experience.
-
Identity complexity slowed digital and application delivery. Application teams faced long cycle times to integrate authentication and authorization, with some interviewees reporting multiweek efforts per application. Identity teams became bottlenecks for new application launches, partner onboarding, and M&A activity, delaying business initiatives that depended on secure access.
-
Scalability limitations constrained growth at peak volumes. Existing identity solutions struggled to handle growing user populations and transaction volumes, particularly for large consumer and financial services organizations. Interviewees cited concerns about performance, throughput, and reliability as digital adoption increased, especially during peak authentication periods.
Solution Requirements
The interviewees searched for a solution that could:
-
Deliver enterprise‑scale performance and reliability across identity use cases. Organizations required an identity platform capable of supporting large user populations and peak authentication volumes without degradation. Ensuring consistent availability and throughput was critical as digital adoption increased across customer, workforce, and partner channels.
-
Strengthen security and compliance while reducing risk exposure. Interviewees needed a solution that could enforce consistent security controls such as encryption, MFA, and policy‑based access while supporting auditability and regulatory compliance. Addressing known gaps in legacy and homegrown approaches was a primary driver, particularly for regulated industries.
-
Simplify fragmented identity environments and reduce technical debt. Organizations sought to consolidate legacy tools, custom code, and third‑party-managed platforms into a more unified identity architecture. Reducing complexity and reliance on brittle, tightly coupled systems was essential to lowering operational risk and long‑term cost of ownership.
-
Accelerate time to change for applications, integrations, and digital journeys. Interviewees required an identity solution that decoupled authentication from individual applications and supported standards‑based, configurable integration. Improving agility for application onboarding, partner access, and digital initiatives was a key requirement to prevent identity from becoming a delivery bottleneck.
Composite Organization
Based on the interviews, Forrester constructed a TEI framework, a composite company, and an ROI analysis that illustrates the areas financially affected. The composite organization is representative of the interviewees’ organizations, and it is used to present the aggregate financial analysis in the next section. The composite organization has the following characteristics:
-
Description of composite. The composite organization represents a large enterprise with $5 billion in annual revenue and a global workforce of 100,000 employees. It operates a complex technology environment that includes 2,000 applications, each requiring identity and access controls. The organization manages identity at scale across multiple populations, including 20 million customer identities, a workforce identity population aligned to employee count, 50,000 partner identities, and tens of thousands of nonhuman identities such as service and system accounts. Identity supports customer access, employee productivity, partner interactions, and application‑to‑application communication, and is a critical capability in a hybrid, multi‑cloud environment with significant regulatory and security requirements. As a result, identity plays a central, enterprisewide role across external and internal interactions, requiring scalable and coordinated implementation across multiple systems and user populations.
-
Deployment characteristics. The composite organization implements Ping Identity across customer, workforce, partner, and nonhuman identity use cases. Deployment includes core Ping Identity Platform capabilities such as authentication, access management, identity orchestration, and governance, along with advanced functions like MFA, risk-based authentication, and identity verification. These capabilities support workforce, customer, partner, and business-to-business identity scenarios, including managing access across organizations and their users through centralized identity policies and workflows. The deployment leverages modular components of the Ping Identity Platform — such as PingOne for Customers, PingOne for Workforce, PingOne Verify, PingOne Protect, PingOne Authorize, PingOne DaVinci, PingOne Credentials, and PingOne Governance — to support a range of identity scenarios. Deployment follows a phased approach after an initial implementation period, with early focus on priority use cases and applications. The rollout integrates with existing legacy and cloud systems and scales over time to support the organization’s full identity landscape while minimizing disruption to users and ongoing operations. The composite conducts large-scale implementations that consolidate fragmented legacy and homegrown identity systems into a centralized platform, rather than incremental expansions of an existing identity environment.
KEY ASSUMPTIONS
-
$5B in annual revenue
-
100,000+ employees
-
20M customer identities
-
2,000 applications requiring identity and access control
Analysis Of Benefits
Quantified benefit data as applied to the composite
Total Benefits
| Ref. | Benefit | Year 1 | Year 2 | Year 3 | Total | Present Value |
|---|---|---|---|---|---|---|
| Atr | Value of new users from improved registration | $239,990 | $239,990 | $239,990 | $719,971 | $596,821 |
| Btr | Value of retaining existing customers from reduced friction | $1,483,515 | $1,492,290 | $1,501,106 | $4,476,911 | $3,709,750 |
| Ctr | Partner onboarding time savings | $1,458,000 | $1,458,000 | $1,458,000 | $4,374,000 | $3,625,830 |
| Dtr | Employee onboarding time savings | $1,620,000 | $1,620,000 | $1,620,000 | $4,860,000 | $4,028,700 |
| Etr | Value of ongoing employee productivity from improved access | $469,334 | $469,334 | $469,334 | $1,408,001 | $1,167,163 |
| Ftr | Value of ongoing IAM time savings from identity operations | $451,250 | $451,250 | $451,250 | $1,353,750 | $1,122,192 |
| Gtr | Ongoing reduction in identity-related support demand through self-service | $1,012,500 | $1,012,500 | $1,012,500 | $3,037,500 | $2,517,938 |
| Htr | Avoided fraud losses | $1,406,250 | $1,406,250 | $1,406,250 | $4,218,750 | $3,497,136 |
| Total benefits (risk-adjusted) | $8,140,839 | $8,149,614 | $8,158,430 | $24,448,883 | $20,265,530 |
Value Of New Users From Improved Registration
Evidence and data. Interviewees described how modernizing registration and authentication reduced friction for new users, improved completion rates, and lowered abandonment during account creation. Specific experiences included:
-
The head of customer IAM in the transportation industry told Forrester: “Our registration flow created friction for new users. When authentication failed, customers often abandoned the process or created duplicate accounts instead of completing registration.”
-
The VP of information security in the travel and hospitality industry said: “New users struggled with passwords and verification during signup. That friction directly impacted how many people actually completed registration.”
-
The technical delivery manager in the financial services industry told Forrester: “Registration journeys were tightly coupled to legacy systems. Even small changes were slow to make, and failures during signup led to users dropping out.”
-
The director of information security in the pharmaceutical industry explained: “Before modernizing identity, registration success was inconsistent. Authentication issues were one of the main reasons users failed to complete onboarding.”
-
The CISO in the business services industry told Forrester, “Inefficient registration and login flows drove unnecessary support calls and reduced the number of users who successfully completed initial access.”
Modeling and assumptions. Based on the interviews, Forrester assumes the following about the composite organization:
-
The composite organization generates 150,000 new paid user registration attempts per year.
-
Before Ping Identity, the composite organization achieves a 90% successful registration rate, with failures driven by authentication friction and incomplete registration flows.
-
After implementing Ping Identity, the composite organization improves successful registration rates to 95%, consistent with interviewee experiences.
-
The improvement in registration success results in 8,333 incremental new paid users per year.
-
Each new paid user generates an average annual value of $320, and the composite organization operates at a 10% operating margin.
-
Only incremental registrations attributable to improved registration success are included in this benefit.
Risks. The value of this benefit can vary across organizations due to the following:
-
Some improvement in registration success may be attributable to broader digital experience improvements rather than identity alone.
-
Actual registration volumes may fluctuate year over year due to changes in demand, marketing effectiveness, or seasonality.
-
Registration success improvements may be lower for organizations with already optimized registration flows before deployment.
-
While registration volumes and performance may vary, the benefit is based on a direct and measurable improvement in registration completion rates, reducing overall uncertainty relative to broader business outcome metrics.
Results. To account for these risks, Forrester adjusted this benefit downward by 10%, yielding a three-year, risk-adjusted total PV (discounted at 10%) of $597,000.
5 percentage points
Increase in successful new user registrations after improving registration and authentication flows
Value Of New Users From Improved Registration
| Ref. | Metric | Source | Year 1 | Year 2 | Year 3 | |
|---|---|---|---|---|---|---|
| A1 | New paid user registrations | Composite | 150,000 | 150,000 | 150,000 | |
| A2 | New paid user registration rate before Ping Identity | Composite | 90% | 90% | 90% | |
| A3 | New user registration rate with Ping Identity | Interviews | 95% | 95% | 95% | |
| A4 | Increase in new user registrations with Ping Identity | (A1/A2)*A3-A1 | 8,333 | 8,333 | 8,333 | |
| A5 | Average annual value of a new customer registration | Composite | $320 | $320 | $320 | |
| A6 | Operating margin | Composite | 10% | 10% | 10% | |
| At | Value of new users from improved registration | A4*A5*A6 | $266,656 | $266,656 | $266,656 | |
| Risk adjustment | ↓10% | |||||
| Atr | Value of new users from improved registration (risk-adjusted) | $239,990 | $239,990 | $239,990 | ||
| Three-year total: $719,971 | Three-year present value: $596,821 | |||||
Value Of Retaining Existing Customers From Reduced Friction
Evidence and data. Interviewees described how improving authentication reliability, reducing login friction, and strengthening security controls reduced customer frustration and helped retain existing users. Specific experiences included:
-
The VP of information security in the travel and hospitality industry said: “When customers struggled to log in or reset passwords, they were far more likely to disengage. Reducing authentication friction helped keep existing users active.”
-
The head of customer IAM in the transportation industry told Forrester: “Account lockouts and failed logins created frustration for returning customers. Improving authentication reliability reduced drop-off and repeat support contacts.”
-
The director of security engineering in the financial services industry said: “Inconsistent MFA and legacy authentication caused repeated access issues. Those experiences directly impacted customer trust and ongoing engagement.”
-
Interviewees also noted that reducing authentication failures, account lockouts, and password-related friction improved overall user satisfaction and reduced the likelihood of customers abandoning digital channels over time.
Modeling and assumptions. Based on the interviews, Forrester assumes the following about the composite organization:
-
The composite organization maintains 20 million paid user accounts in Year 1, which increases annually.
-
Before Ping Identity, the composite organization achieves an average annual retention rate of 91.0%, reflecting friction from login failures, security challenges, and inconsistent authentication experiences.
-
After implementing Ping Identity, the composite organization improves retention by 0.5 percentage points, reaching 91.5%, consistent with interviewee observations.
-
Each retained user generates an average annual value of $180, and the composite organization operates at a 10% operating margin.
-
Only incremental retention attributable to improved identity experiences is included in this benefit.
Risks. The value of this benefit can vary across organizations due to the following:
-
Improvements in retention may also be influenced by non‑identity factors such as pricing, product quality, or customer service initiatives.
-
Retention gains may be lower for organizations that already had strong authentication experiences before deployment.
-
Some benefits of improved authentication may manifest gradually rather than immediately within the modeled period.
-
Customer retention is influenced by numerous factors beyond identity, including competitive dynamics, product offerings, pricing, and customer experience initiatives, increasing uncertainty in attributing the full benefit to identity improvements alone.
Results. To account for these risks, Forrester adjusted this benefit downward by 25%, yielding a three-year, risk-adjusted total PV (discounted at 10%) of $3.7 million.
0.5 percentage points
Increase in customer retention attributable to reduced authentication friction and improved access reliability
Value Of Retaining Existing Customers From Reduced Friction
| Ref. | Metric | Source | Year 1 | Year 2 | Year 3 | |
|---|---|---|---|---|---|---|
| B1 | Paid user accounts | Composite | 20,000,000 | 20,118,223 | 20,237,096 | |
| B2 | Retention before Ping Identity | Composite | 91.0% | 91.0% | 91.0% | |
| B3 | Retention with Ping Identity | Interviews | 91.5% | 91.5% | 91.5% | |
| B4 | Retained user accounts with Ping Identity | (B1/B2)*B3-B1 | 109,890 | 110,540 | 111,193 | |
| B5 | Average annual value of an existing user | Composite | $180 | $180 | $180 | |
| B6 | Operating margin | Composite | 10% | 10% | 10% | |
| Bt | Value of retaining existing customers from reduced friction | B4*B5*B6 | $1,978,020 | $1,989,720 | $2,001,474 | |
| Risk adjustment | ↓25% | |||||
| Btr | Value of retaining existing customers from reduced friction (risk-adjusted) | $1,483,515 | $1,492,290 | $1,501,106 | ||
| Three-year total: $4,476,911 | Three-year present value: $3,709,750 | |||||
Partner Onboarding Time Savings
Evidence and data. Interviewees described how standardizing identity, automating provisioning, and decoupling access management from individual applications significantly reduced the time required to onboard partners. Specific experiences included:
-
The head of customer IAM in the transportation industry said: “Partner onboarding used to take weeks of coordination and manual setup. After centralizing identity, most partners could be onboarded in a matter of hours instead of days.”
-
Several interviewees reported reducing partner onboarding effort from multiple days or weeks to a few hours after implementing centralized identity and automation.
Modeling and assumptions. Based on the interviews, Forrester assumes the following about the composite organization:
-
The composite organization onboards 2,000 partners per year.
-
Before Ping Identity, partner onboarding required an average of 40 hours per partner from manual configuration, custom integrations, and cross‑team coordination.
-
With Ping Identity, partner onboarding effort decreases to 4 hours per partner, consistent with interviewee experiences.
-
CIAM resources have a fully burdened hourly rate of $45, and 50% of recovered time is applied to value‑added work.
Risks. The value of this benefit can vary across organizations due to the following:
-
Actual onboarding time reductions may depend on the degree of automation and integration achieved during deployment.
-
Some partners may require additional approvals or manual steps that limit achievable time savings.
-
Recovered time may be partially absorbed by other operational demands rather than fully redirected to value‑added activities.
-
The modeled benefit is based on direct reductions in onboarding effort and process time, making outcomes relatively observable and measurable once identity workflows are standardized.
Results. To account for these risks, Forrester adjusted this benefit downward by 10%, yielding a three-year, risk-adjusted total PV (discounted at 10%) of $3.6 million.
90%
Reduction in partner onboarding effort after standardizing and automating identity workflows
Partner Onboarding Time Savings
| Ref. | Metric | Source | Year 1 | Year 2 | Year 3 | |
|---|---|---|---|---|---|---|
| C1 | Partners onboarded | Composite | 2,000 | 2,000 | 2,000 | |
| C2 | Onboarding time per partner before Ping Identity (hours) | Composite | 40 | 40 | 40 | |
| C3 | Onboarding time per partner with Ping Identity (hours) | Interviews | 4 | 4 | 4 | |
| C4 | Fully burdened hourly rate for CIAM team resources | Composite | $45 | $45 | $45 | |
| C5 | Percentage of recovered time applied to value-added work tasks | TEI methodology | 50% | 50% | 50% | |
| Ct | Partner onboarding time savings | C1*(C2-C3)*C4*C5 | $1,620,000 | $1,620,000 | $1,620,000 | |
| Risk adjustment | ↓10% | |||||
| Ctr | Partner onboarding time savings (risk-adjusted) | $1,458,000 | $1,458,000 | $1,458,000 | ||
| Three-year total: $4,374,000 | Three-year present value: $3,625,830 | |||||
Employee Onboarding Time Savings
Evidence and data. Interviewees described how standardizing identity, automating provisioning, and decoupling access management from individual applications significantly reduced the time required to onboard employees. Specific experiences included:
-
The director of information security in the pharmaceutical industry told Forrester: “Provisioning access for new employees was highly manual and required multiple teams. Automating identity reduced onboarding time dramatically.”
-
The technical delivery manager in the financial services industry said: “New hires often waited days for full access. Automating provisioning cut that time down to a fraction of what it was before.”
-
Several interviewees reported reducing employee access provisioning from many hours to a small number of hours after implementing centralized identity and automation.
Modeling and assumptions. Based on the interviews, Forrester assumes the following about the composite organization:
-
The composite organization onboards 10,000 employees per year.
-
Before Ping Identity, employee access provisioning required an average of 10 hours per employee.
-
With Ping Identity, access provisioning effort decreases to 2 hours per employee through automation and standardized workflows.
-
CIAM resources have a fully burdened hourly rate of $45, and 50% of recovered time is applied to value‑added work.
Risks. The value of this benefit can vary across organizations due to the following:
-
Actual onboarding time reductions may depend on the degree of automation and integration achieved during deployment.
-
Some employee roles may require additional approvals or manual steps that limit achievable time savings.
-
Recovered time may be partially absorbed by other operational demands rather than fully redirected to value‑added activities.
-
Because the benefit is tied to measured reductions in provisioning effort and onboarding activities, actual results can be observed and validated through operational metrics following deployment.
Results. To account for these risks, Forrester adjusted this benefit downward by 10%, yielding a three-year, risk-adjusted total PV (discounted at 10%) of $4.0 million.
Employee Onboarding Time Savings
| Ref. | Metric | Source | Year 1 | Year 2 | Year 3 | |
|---|---|---|---|---|---|---|
| D1 | Employees onboarded | Composite | 10,000 | 10,000 | 10,000 | |
| D2 | Access provisioning time per employee before Ping Identity (hours) | Composite | 10 | 10 | 10 | |
| D3 | Access provisioning time per employee with Ping Identity (hours) | Interviews | 2 | 2 | 2 | |
| D4 | Fully burdened hourly rate for CIAM team resource | Composite | $45 | $45 | $45 | |
| D5 | Percentage of recovered time applied to value-added work tasks | TEI methodology | 50% | 50% | 50% | |
| Dt | Employee onboarding time savings | D1*(D2-D3)*D4*D5 | $1,800,000 | $1,800,000 | $1,800,000 | |
| Risk adjustment | ↓10% | |||||
| Dtr | Employee onboarding time savings (risk-adjusted) | $1,620,000 | $1,620,000 | $1,620,000 | ||
| Three-year total: $4,860,000 | Three-year present value: $4,028,700 | |||||
Value Of Ongoing Employee Productivity From Improved Access
Evidence and data. Interviewees described how improving login reliability, reducing password resets and lockouts, and enabling faster recovery reduced productivity losses for employees attempting to access internal systems. Specific experiences included:
-
The director of security engineering in the financial services industry said: “Employees regularly lost time to password resets and account lockouts. Improving login success reduced those interruptions during the workday.”
-
The VP of information security in the travel and hospitality industry told Forrester, “Failed logins and recovery steps disrupted employee workflows, especially for users accessing multiple systems throughout the day.”
-
Several interviewees reported that improving authentication success and recovery reduced the time employees spent resolving access issues by approximately 15% to 25%.
Modeling and assumptions. Based on the interviews, Forrester assumes the following about the composite organization:
-
The composite organization has 100,000 employees using Ping Identity-managed authentication.
-
Employees log in to corporate applications an average of eight times per day.
-
Before Ping Identity, approximately 0.5% of login attempts resulted in a password reset or account lockout.
-
Each password reset or lockout required an average of 10 minutes for the employee to remediate.
-
With Ping Identity, the composite organization improves login success and recovery time by 20%, consistent with interviewee feedback.
-
Employees have a fully burdened hourly rate of $40, and 50% of recovered time is applied to value‑added work.3
Risks. The value of this benefit can vary across organizations due to the following:
-
Login failure rates may vary depending on the number of applications and authentication policies in place.
-
Some productivity gains may be offset if employees multitask or shift attention during recovery events.
-
Organizations with already optimized authentication experiences may see smaller improvements.
-
Productivity benefits depend on employees redirecting recovered time toward value-added work, which may vary across organizations and business functions.
Results. To account for these risks, Forrester adjusted this benefit downward by 20%, yielding a three-year, risk-adjusted total PV (discounted at 10%) of $1.2 million.
20%
Improvement in employee login success and recovery time after modernizing authentication
Value Of Ongoing Employee Productivity From Improved Access
| Ref. | Metric | Source | Year 1 | Year 2 | Year 3 | |
|---|---|---|---|---|---|---|
| E1 | Employees with Ping Identity accounts | Composite | 100,000 | 100,000 | 100,000 | |
| E2 | Average logins per day per person | Composite | 8 | 8 | 8 | |
| E3 | Average time to reset password or remediate lockout before Ping Identity (minutes) | Composite | 10 | 10 | 10 | |
| E4 | Percentage of login attempts that lead to password reset or lockout | Composite | 0.5% | 0.5% | 0.5% | |
| E5 | Improvement in login success and recovery time with Ping Identity | Interviews | 20% | 20% | 20% | |
| E6 | Fully burdened hourly rate for an employee | Composite | $40 | $40 | $40 | |
| E7 | Percentage of recovered time applied to value-added work tasks | TEI methodology | 50% | 50% | 50% | |
| Et | Value of ongoing employee productivity from improved access | (E1*E2)*E4*E5*E3/60*E6*E7*220 | $586,667 | $586,667 | $586,667 | |
| Risk adjustment | ↓20% | |||||
| Etr | Value of ongoing employee productivity from improved access (risk-adjusted) | $469,334 | $469,334 | $469,334 | ||
| Three-year total: $1,408,001 | Three-year present value: $1,167,163 | |||||
Value Of Ongoing IAM Time Savings From Identity Operations
Evidence and data. Interviewees described how consolidating identity platforms, reducing manual intervention, and simplifying ongoing administration allowed IAM teams to spend less time on operational tasks and more time on higher‑value activities. Specific experiences included:
-
The director of security engineering in the financial services industry said: “A significant portion of our team’s time was spent maintaining legacy identity systems. Consolidation reduced that operational overhead.”
-
The CISO in the business services industry told Forrester, “Reducing manual configuration and maintenance allowed the team to focus more on governance, security improvements, and strategic initiatives.”
-
Several interviewees noted that simplifying identity operations resulted in platform consolidation, reduced manual intervention, and easier ongoing management, which drove efficiency gains and enabled a measurable portion of IAM team capacity to be redirected from maintenance activities to higher‑value work.
Modeling and assumptions. Based on the interviews, Forrester assumes the following about the composite organization:
-
The composite organization employs a 50‑person IAM team responsible for identity operations and administration.
-
After implementing Ping Identity, 20% of IAM team capacity is redirected from operational maintenance to higher‑value activities.
-
IAM team members have an average fully burdened annual salary of $95,000.
-
Only productivity gains that result in redeployed capacity are included in this benefit.
Risks. The value of this benefit can vary across organizations due to the following:
-
The extent of efficiency gains depends on how fully legacy systems are retired.
-
Some operational tasks may persist due to organizational or regulatory requirements.
-
Redeployed capacity may be absorbed by new initiatives rather than producing directly measurable productivity gains.
-
The benefit is based on defined IAM team resources, documented operational activities, and measurable reductions in administration effort, resulting in relatively low uncertainty compared with customer-facing or behavior-driven benefits.
Results. To account for these risks, Forrester adjusted this benefit downward by 5%, yielding a three-year, risk-adjusted total PV (discounted at 10%) of $1.1 million.
20%
CIAM team capacity redirected to higher‑value work after consolidating identity platforms
Value Of Ongoing IAM Time Savings From Identity Operations
| Ref. | Metric | Source | Year 1 | Year 2 | Year 3 | |
|---|---|---|---|---|---|---|
| F1 | IAM team before Ping Identity | Composite | 50 | 50 | 50 | |
| F2 | Percentage of team resources moved to other higher-value work | Interviews | 20% | 20% | 20% | |
| F3 | Fully burdened annual salary for a IAM team member | Composite | $95,000 | $95,000 | $95,000 | |
| F4 | Productivity recapture | TEI methodology | 50% | 50% | 50% | |
| Ft | Value of ongoing IAM time savings from identity operations | F1*F2*F3*F4 | $475,000 | $475,000 | $475,000 | |
| Risk adjustment | ↓5% | |||||
| Ftr | Value of ongoing IAM time savings from identity operations (risk-adjusted) | $451,250 | $451,250 | $451,250 | ||
| Three-year total: $1,353,750 | Three-year present value: $1,122,192 | |||||
Ongoing Reduction In Identity-Related Support Demand Through Self-Service
Evidence and data. Interviewees described how introducing self‑service authentication capabilities, including password reset, MFA enrollment, and account recovery, significantly reduced identity‑related help desk and call center volumes. Specific experiences included:
-
The VP of information security in the travel and hospitality industry said: “Before self-service and MFA, we were handling hundreds of authentication-related tickets every month. After rollout, that volume dropped dramatically.”
-
The head of customer IAM in the transportation industry said: “Password resets and account lockouts drove a large share of support calls. Enabling self-service removed the need for customers to contact the help desk in most cases.”
-
The CISO in the business services industry told Forrester: “Identity-related issues were a constant drain on support resources. With self-service options in place, the majority of those tickets disappeared.”
-
Several interviewees reported reductions of approximately 80% to 90% in identity-related tickets after deploying self-service authentication capabilities, reflecting a significant shift from manual support to automated user-driven recovery.
Modeling and assumptions. Based on the interviews, Forrester assumes the following about the composite organization:
-
The composite organization receives 50,000 identity‑related help desk or call center tickets per month before implementing Ping Identity.
-
After deploying self‑service options, the composite organization reduces identity‑related ticket volume by 90%, consistent with interviewee reports.
-
Remaining tickets primarily relate to exceptional cases such as device issues or complex access scenarios.
-
Each identity‑related ticket requires an average of 5 minutes of help desk effort.
-
The fully burdened hourly rate for a help desk employee is $25.
Risks. The value of this benefit can vary across organizations due to the following:
-
Actual ticket reduction may be lower if self‑service features are not broadly adopted by users.
-
Some organizations may continue to route certain authentication issues through support due to policy or regulatory requirements.
-
Help desk cost savings may be partially offset if support staff are redeployed rather than reduced.
Results. To account for these risks, Forrester adjusted this benefit downward by 10%, yielding a three-year, risk-adjusted total PV (discounted at 10%) of $2.5 million.
90%
Reduction in identity‑related help desk and call center tickets after enabling self‑service authentication
Ongoing Reduction In Identity-Related Support Demand Through Self-Service
| Ref. | Metric | Source | Year 1 | Year 2 | Year 3 | |
|---|---|---|---|---|---|---|
| G1 | Identity-related call center tickets per month before Ping Identity | B1/400 | 50,000 | 50,000 | 50,000 | |
| G2 | Reduction in tickets with self-service options | Interviews | 90% | 90% | 90% | |
| G3 | Identity-related tickets per month with Ping Identity | G1*(1-G2) | 5,000 | 5,000 | 5,000 | |
| G4 | Average time per identity-related ticket (minutes) | Composite | 5 | 5 | 5 | |
| G5 | Fully burdened hourly rate for a help desk employee | Composite | $25 | $25 | $25 | |
| Gt | Ongoing reduction in identity-related support demand through self-service | (G1-G3)*G5*G4/60*12 | $1,125,000 | $1,125,000 | $1,125,000 | |
| Risk adjustment | ↓10% | |||||
| Gtr | Ongoing reduction in identity-related support demand through self-service (risk-adjusted) | $1,012,500 | $1,012,500 | $1,012,500 | ||
| Three-year total: $3,037,500 | Three-year present value: $2,517,938 | |||||
Avoided Fraud Losses
Evidence and data. Interviewees described how improving authentication strength, enforcing MFA, and centralizing identity management across applications reduced fraud risk and limited account takeover (ATO) losses associated with compromised credentials. Centralizing identity provided greater visibility into access activity and identity lifecycles, enabling their organizations to monitor access across applications, identify anomalous behavior, and reduce fragmented authentication surfaces that increased exposure to attack. Specific experiences included:
-
The director of security engineering in the financial services industry said: “Account takeover was a persistent issue before stronger authentication. Implementing consistent MFA significantly reduced successful fraud attempts.”
-
The global security technology officer in the insurance industry told Forrester: “Legacy authentication made it easier for attackers to compromise accounts. Strengthening identity controls reduced the volume and impact of fraud events.”
-
The CISO in the business services industry told Forrester, “Reducing account takeover incidents had a measurable impact on fraud losses, particularly for high‑value customer accounts.”
-
Several interviewees also reported that improving authentication controls reduced fraud losses related to account takeovers by approximately 20% to 30%, depending on user population and use case. Fraud reduction was driven by stronger authentication controls, broader MFA adoption, and improved detection and prevention of compromised credentials.
-
Interviewees also noted that improving visibility into identity activity enabled faster identification of misconfigured or inactive accounts, reducing the risk of unauthorized access through orphaned or unmanaged identities.
-
The director of security engineering in the financial services industry told Forrester: “Before centralizing identity, access controls were inconsistent across applications and difficult to monitor. With a unified identity platform, we gained visibility across access activity and could more quickly identify and address potential security gaps.”
Modeling and assumptions. Based on the interviews, Forrester assumes the following about the composite organization:
-
The composite organization experiences $7.5 million per year in fraud losses attributable to account takeovers before implementing Ping Identity.
-
After deploying Ping Identity, the composite organization reduces fraud losses related to account takeovers by 25%, consistent with interviewee feedback.
-
Only fraud losses directly attributable to account takeovers are included in this benefit.
Risks. The value of this benefit can vary across organizations due to the following:
-
Fraud loss reductions may be influenced by other security investments or fraud prevention tools beyond identity.
-
Actual fraud exposure varies significantly by industry, user behavior, and threat environment.
-
Some fraud losses may shift to other attack vectors not directly addressed by authentication improvements.
Results. To account for these risks, Forrester adjusted this benefit downward by 25%, yielding a three-year, risk-adjusted total PV (discounted at 10%) of $3.5 million.
25%
Reduction in account takeover-related fraud losses after strengthening authentication controls
Avoided Fraud Losses
| Ref. | Metric | Source | Year 1 | Year 2 | Year 3 | |
|---|---|---|---|---|---|---|
| H1 | Fraud losses as a result of account takeovers before Ping Identity | Composite | $7,500,000 | $7,500,000 | $7,500,000 | |
| H2 | Reduction in fraud losses attributed to Ping Identity | Interviews | 25% | 25% | 25% | |
| Ht | Avoided fraud losses | H1*H2 | $1,875,000 | $1,875,000 | $1,875,000 | |
| Risk adjustment | ↓25% | |||||
| Htr | Avoided fraud losses (risk-adjusted) | $1,406,250 | $1,406,250 | $1,406,250 | ||
| Three-year total: $4,218,750 | Three-year present value: $3,497,136 | |||||
Unquantified Benefits
Interviewees mentioned the following additional benefits that their organizations experienced but were not able to quantify:
-
Greater confidence in enterprise security and compliance posture at scale. Interviewees consistently noted increased assurance that identity controls aligned with internal security standards and external regulatory requirements. This confidence reduces executive concern for audit readiness, data protection, and operational risk while strengthening overall governance and risk management across their organizations.
-
Improved ongoing partner management, relationships, and efficiency. Interviewees described how fragmented identity systems and manual coordination created friction not only during partner onboarding but also in maintaining partner access and supporting ongoing partner interactions across applications. By centralizing identity and standardizing access management, organizations reduced ongoing coordination effort, improved partner access reliability, and enabled partners to begin transacting more quickly following onboarding. These improvements contribute to more consistent partner engagement, improved partner experience and business relationships, maintained partnership retention, and reduced operational friction over time.
-
Improved resiliency and speed to response for identity-related security events. Interviewees described how centralizing identity and reducing fragmented attack surfaces improves visibility into identity activity and enables faster detection and response to potential security issues. These capabilities will allow their organizations to identify and prioritize threats more quickly, isolate impacted accounts, and reduce remediation time, strengthening overall operational resilience and security responsiveness.
-
Improved organizational ownership and governance of identity capabilities. Interviewees reported stronger internal control over identity strategy and execution after moving away from heavily customized or third-party-managed identity environments. This shift enables clearer accountability, improved cross-team coordination, and more proactive planning for identity-dependent initiatives, supporting more consistent execution of identity strategy across the enterprise.
-
Reduced long‑term architectural complexity and technical debt. Several interviewees highlighted the strategic value of simplifying fragmented identity architectures and consolidating legacy tools onto a unified platform. Reducing complexity improves system stability, supports more efficient integration and maintenance, and positions their organizations to scale identity capabilities more effectively as business and technology needs evolve.
Flexibility
The value of flexibility is unique to each customer. There are multiple scenarios in which a customer might implement Ping Identity and later realize additional uses and business opportunities, including:
-
Adopting new digital and identity‑driven initiatives without rearchitecting core systems. Interviewees indicated that Ping Identity positioned their organizations to pursue future initiatives, such as passwordless authentication, advanced identity orchestration, expanded partner access, and nonhuman or agent‑based identities, without needing to replace or redesign the underlying identity foundation.
-
Scaling identity capabilities as business models, users, and channels evolve. Interviewees described Ping Identity as a platform that could scale alongside growth in user populations, transaction volumes, and digital channels. This reduced concerns that identity would become a limiting factor as they introduced new applications, partners, or customer experiences.
-
Supporting future automation and AI-driven identity use cases as requirements evolve. Interviewees described AI and automation primarily in terms of future readiness rather than current deployment, indicating that Ping Identity positions their organizations to explore emerging use cases such as delegated actions, intelligent services, and nonhuman identity interactions. By enabling identity policies and controls to adapt over time, the platform supports evolving AI-driven operating models without requiring a redesign of the core identity architecture.
-
Expanding identity functionality incrementally through modular adoption.
Interviewees noted that Ping Identity’s modular packaging would enable their organizations to add capabilities over time, such as enhanced fraud protection, stronger verification, or additional credential types, supporting expansion without large upfront investments or rip‑and‑replace efforts. -
Supporting faster experimentation and innovation over time. By decoupling identity from individual applications, interviewees reported greater flexibility to experiment with new access models, integrations, and digital journeys, knowing that identity policies and capabilities could be adapted as requirements change.
Flexibility would also be quantified when evaluated as part of a specific project (described in more detail in Total Economic Impact Approach).
Analysis Of Costs
Quantified cost data as applied to the composite
Total Costs
| Ref. | Cost | Initial | Year 1 | Year 2 | Year 3 | Total | Present Value |
|---|---|---|---|---|---|---|---|
| Itr | Implementation and setup | $1,622,250 | $0 | $0 | $0 | $1,622,250 | $1,622,250 |
| Jtr | Software subscription costs | $0 | $1,015,000 | $1,015,000 | $1,015,000 | $3,045,000 | $2,524,155 |
| Ktr | Ongoing labor and governance | $0 | $252,000 | $252,000 | $252,000 | $756,000 | $626,687 |
| Total costs (risk-adjusted) | $1,622,250 | $1,267,000 | $1,267,000 | $1,267,000 | $5,423,250 | $4,773,092 |
Implementation And Setup
Evidence and data. Interviewees described implementation efforts that reflected a comprehensive identity modernization initiative, requiring their organizations to transition from fragmented or legacy identity environments to a centralized identity platform. As a result, deployment involved significant planning, integration, and coordination across multiple identity use cases rather than a simple point-solution implementation. Interviewees described implementation efforts that included internal labor and third-party support to deploy, integrate, and configure Ping Identity across workforce, customer, and partner identity environments. Specific experiences included:
-
Interviewees’ organizations undertook complex, multi-phase deployments, integrating Ping Identity with existing legacy and cloud systems across workforce, customer, and partner identity environments.
-
Implementation efforts required internal engineering and IAM resources to support integration, configuration, policy design, and migration from legacy identity solutions.
-
Organizations also engaged third-party implementation partners, including system integrators and managed service providers, to support deployment and configuration and accelerate time to value.
-
Interviewees noted that implementation efforts were typically front-loaded during an initial deployment period, after which reliance on external support decreased significantly as internal teams assumed ongoing management.
Modeling and assumptions. Based on the interviews, Forrester assumes the following about the composite organization:
-
The composite organization completes an initial Ping Identity implementation that includes deployment, integration, and configuration across core identity use cases, including workforce and customer identity use cases.
-
The internal implementation costs reflect the effort of engineering, IAM, and application teams required to deploy, integrate, and transition to a centralized identity platform across workforce, customer, and partner use cases.
-
As part of implementation, the composite must onboard applications to standardize identity workflows and coordinate across multiple teams and systems, often through phased deployments or parallel environments to reduce risk, due to its distributed application environment.
-
The composite incurs third-party professional services costs for external support from implementation partners and service providers used to accelerate deployment and supplement internal capabilities.
-
All implementation and setup costs are incurred during the initial deployment period prior to steady-state operations.
Risks. The value of this cost can vary across organizations due to the following:
-
Implementation costs may increase depending on the number of applications, integrations, and identity use cases included in the initial scope.
-
Organizations with more complex legacy environments or heavily customized identity systems may require greater internal effort or additional third-party support.
-
The level of reliance on external partners versus internal resources may vary based on internal capabilities, timelines, and deployment approach.
Results. To account for these risks, Forrester adjusted this cost upward by 5%, yielding a three-year, risk-adjusted total PV (discounted at 10%) of $1.6 million.
Implementation And Setup
| Ref. | Metric | Source | Initial | Year 1 | Year 2 | Year 3 |
|---|---|---|---|---|---|---|
| I1 | Internal implementation labor | Interviews | $845,000 | |||
| I2 | Third-party professional services | Interviews | $700,000 | |||
| It | Implementation and setup | I1+I2 | $1,545,000 | $0 | $0 | $0 |
| Risk adjustment | ↑5% | |||||
| Itr | Implementation and setup (risk-adjusted) | $1,622,250 | $0 | $0 | $0 | |
| Three-year total: $1,622,250 | Three-year present value: $1,622,250 | |||||
Software Subscription Costs
Evidence and data. Interviewees described ongoing software costs associated with maintaining and operating Ping Identity following the initial deployment. Specific experiences included:
-
Organizations incurred ongoing subscription costs to support workforce, customer, and partner identity use cases across cloud and hybrid environments.
-
Subscription costs were described as recurring annual expenses, typically aligned to user volumes, identity types, and the scope of deployed functionality.
-
Interviewees noted that subscription costs reflected access to a broad set of identity capabilities, including authentication, access management, identity orchestration, and security features such as MFA and risk-based authentication.
-
Pricing varied based on factors such as scale, identity volumes, selected platform components, and commercial agreements, and differed across interviewees’ organizations depending on specific requirements.
Modeling and assumptions. Based on the interviews and vendor-provided pricing, Forrester assumes the following about the composite organization:
-
The composite organization pays an annual subscription fee for Ping Identity that supports workforce and customer identity use cases across its user populations and application landscape.
-
Subscription costs reflect the licensing of Ping Identity platform components, including authentication, access management, identity orchestration, and related security capabilities.
-
The annual subscription cost remains consistent over the three-year period, reflecting steady-state usage following initial deployment.
-
Subscription pricing is derived from vendor-provided unit pricing inputs and scaled to the identity volumes and scope of the composite organization, including customer, workforce, and partner identity use cases.
Risks. The value of this cost can vary across organizations due to the following:
-
Subscription costs may increase based on user volumes, transaction volumes, and growth in identity populations over time.
-
Organizations adopting additional capabilities or expanding use cases may incur higher licensing costs depending on platform usage and configuration.
-
Pricing may vary depending on contract terms, geographic factors, and negotiated agreements.
Results. To account for these risks, Forrester adjusted this cost upward by 0%, yielding a three-year, risk-adjusted total PV (discounted at 10%) of $2.5 million.
Software Subscription Costs
| Ref. | Metric | Source | Initial | Year 1 | Year 2 | Year 3 |
|---|---|---|---|---|---|---|
| J1 | Software subscription costs | Ping Identity | $1,015,000 | $1,015,000 | $1,015,000 | |
| Jt | Software subscription costs | J1 | $0 | $1,015,000 | $1,015,000 | $1,015,000 |
| Risk adjustment | 0% | |||||
| Jtr | Software subscription costs (risk-adjusted) | $0 | $1,015,000 | $1,015,000 | $1,015,000 | |
| Three-year total: $3,045,000 | Three-year present value: $2,524,155 | |||||
Ongoing Labor And Governance
Evidence and data. Interviewees described steady-state operations for identity platforms as requiring ongoing internal resources to manage, maintain, and optimize identity capabilities following implementation. Specific experiences included:
-
Interviewees’ organizations maintained dedicated IAM resources responsible for administration, configuration, and ongoing support of the identity platform.
-
Ongoing activities included policy updates, user and access management, system monitoring, and support for new application integrations, as identity requirements evolved over time.
-
Interviewees noted that consolidating identity platforms and standardizing workflows reduced manual effort compared to prior environments but still required continued internal ownership and governance.
-
Interviewees described a shift from implementation-heavy effort to steady-state operational management, with smaller teams responsible for maintaining and enhancing identity services.
Modeling and assumptions. Based on the interviews and composite modeling assumptions, Forrester assumes the following about the composite organization:
-
The composite organization maintains ongoing internal resources to support the administration, governance, and optimization of Ping Identity following initial deployment.
-
Ongoing labor reflects a combination of roles responsible for identity platform management, including administration, engineering support, and governance oversight.
-
Forrester modeled a small, dedicated team supporting identity operations, consistent with reported reductions in operational complexity following platform consolidation.
-
Ongoing labor costs remain consistent throughout the three-year period, reflecting steady-state operation after the initial implementation phase.
Risks. The value of this cost can vary across organizations due to the following:
-
Ongoing labor requirements may increase depending on the complexity of the identity environment and number of integrated applications.
-
Organizations with less mature identity processes or higher customization may require additional administrative or engineering resources.
-
Resource needs may vary based on organizational structure, governance maturity, and allocation of responsibilities across teams.
Results. To account for these risks, Forrester adjusted this cost upward by 5%, yielding a three-year, risk-adjusted total PV (discounted at 10%) of $627,000.
Ongoing Labor And Governance
| Ref. | Metric | Source | Initial | Year 1 | Year 2 | Year 3 |
|---|---|---|---|---|---|---|
| K1 | Ongoing labor and governance | Interviews | $240,000 | $240,000 | $240,000 | |
| Kt | Ongoing labor and governance | K1 | $0 | $240,000 | $240,000 | $240,000 |
| Risk adjustment | ↑5% | |||||
| Ktr | Ongoing labor and governance (risk-adjusted) | $0 | $252,000 | $252,000 | $252,000 | |
| Three-year total: $756,000 | Three-year present value: $626,687 | |||||
Financial Summary
Consolidated Three-Year, Risk-Adjusted Metrics
Cash Flow Chart (Risk-Adjusted)
Cash Flow Analysis (Risk-Adjusted)
| Initial | Year 1 | Year 2 | Year 3 | Total | Present Value | |
|---|---|---|---|---|---|---|
| Total costs | ($1,622,250) | ($1,267,000) | ($1,267,000) | ($1,267,000) | ($5,423,250) | ($4,773,092) |
| Total benefits | $0 | $8,140,839 | $8,149,614 | $8,158,430 | $24,448,883 | $20,265,530 |
| Net benefits | ($1,622,250) | $6,873,839 | $6,882,614 | $6,891,430 | $19,025,633 | $15,492,438 |
| ROI | 325% | |||||
| Payback | <6 months |
Please Note
The financial results calculated in the Benefits and Costs sections can be used to determine the ROI, NPV, and payback period for the composite organization’s investment. Forrester assumes a yearly discount rate of 10% for this analysis.
These risk-adjusted ROI, NPV, and payback period values are determined by applying risk-adjustment factors to the unadjusted results in each Benefit and Cost section.
The initial investment column contains costs incurred at “time 0” or at the beginning of Year 1 that are not discounted. All other cash flows are discounted using the discount rate at the end of the year. PV calculations are calculated for each total cost and benefit estimate. NPV calculations in the summary tables are the sum of the initial investment and the discounted cash flows in each year. Sums and present value calculations of the Total Benefits, Total Costs, and Cash Flow tables may not exactly add up, as some rounding may occur.
From the information provided in the interviews, Forrester constructed a Total Economic Impact™ framework for those organizations considering an investment in Ping Identity.
The objective of the framework is to identify the cost, benefit, flexibility, and risk factors that affect the investment decision. Forrester took a multistep approach to evaluate the impact that Ping Identity can have on an organization.
Due Diligence
Interviewed Ping Identity stakeholders and Forrester analysts to gather data relative to Ping Identity.
Interviews
Interviewed eight decision-makers at organizations using Ping Identity to obtain data about costs, benefits, and risks.
Composite Organization
Designed a composite organization based on characteristics of the interviewees’ organizations.
Financial Model Framework
Constructed a financial model representative of the interviews using the TEI methodology and risk-adjusted the financial model based on issues and concerns of the interviewees.
Case Study
Employed four fundamental elements of TEI in modeling the investment impact: benefits, costs, flexibility, and risks. Given the increasing sophistication of ROI analyses related to IT investments, Forrester’s TEI methodology provides a complete picture of the total economic impact of purchase decisions. Please see Appendix A for additional information on the TEI methodology.
Total Economic Impact Approach
Benefits
Benefits represent the value the solution delivers to the business. The TEI methodology places equal weight on the measure of benefits and costs, allowing for a full examination of the solution’s effect on the entire organization.
Costs
Costs comprise all expenses necessary to deliver the proposed value, or benefits, of the solution. The methodology captures implementation and ongoing costs associated with the solution.
Flexibility
Flexibility represents the strategic value that can be obtained for some future additional investment building on top of the initial investment already made. The ability to capture that benefit has a PV that can be estimated.
Risks
Risks measure the uncertainty of benefit and cost estimates given: 1) the likelihood that estimates will meet original projections and 2) the likelihood that estimates will be tracked over time. TEI risk factors are based on “triangular distribution.”
Financial Terminology
Present value (PV)
The present or current value of (discounted) cost and benefit estimates given at an interest rate (the discount rate). The PVs of costs and benefits feed into the total NPV of cash flows.
Net present value (NPV)
The present or current value of (discounted) future net cash flows given an interest rate (the discount rate). A positive project NPV normally indicates that the investment should be made unless other projects have higher NPVs.
Return on investment (ROI)
A project’s expected return in percentage terms. ROI is calculated by dividing net benefits (benefits less costs) by costs.
Discount rate
The interest rate used in cash flow analysis to take into account the time value of money. Organizations typically use discount rates between 8% and 16%.
Payback
The breakeven point for an investment. This is the point in time at which net benefits (benefits minus costs) equal initial investment or cost.
Appendix A
Total Economic Impact
Total Economic Impact is a methodology developed by Forrester Research that enhances a company’s technology decision-making processes and assists solution providers in communicating their value proposition to clients. The TEI methodology helps companies demonstrate, justify, and realize the tangible value of business and technology initiatives to both senior management and other key stakeholders.
Appendix b
Endnotes
1 Source: Making The Business Case For Identity And Access Management, Forrester Research, Inc., March 20, 2025.
2 Total Economic Impact is a methodology developed by Forrester Research that enhances a company’s technology decision-making processes and assists solution providers in communicating their value proposition to clients. The TEI methodology helps companies demonstrate, justify, and realize the tangible value of business and technology initiatives to both senior management and other key stakeholders.
Disclosures
Readers should be aware of the following:
This study is commissioned by Ping Identity and delivered by Forrester Consulting. It is not meant to be used as a competitive analysis.
Forrester makes no assumptions as to the potential ROI that other organizations will receive. Forrester strongly advises that readers use their own estimates within the framework provided in the study to determine the appropriateness of an investment in Ping Identity. For any interactive functionality, the intent is for the questions to solicit inputs specific to a prospect’s business. Forrester believes that this analysis is representative of what companies may achieve with Ping Identity based on the inputs provided and any assumptions made. Forrester does not endorse Ping Identity or its offerings. Although great care has been taken to ensure the accuracy and completeness of this model, Ping Identity and Forrester Research are unable to accept any legal responsibility for any actions taken on the basis of the information contained herein. The interactive tool is provided ‘AS IS,’ and Forrester and Ping Identity make no warranties of any kind.
Ping Identity reviewed and provided feedback to Forrester, but Forrester maintains editorial control over the study and its findings and does not accept changes to the study that contradict Forrester’s findings or obscure the meaning of the study.
Ping Identity provided the customer names for the interviews but did not participate in the interviews.
Consulting Team:
Roger Nauth
Published
July 2026
 PDF
PDF