[CONTENT]
$
USD
Total Economic Impact
Cost Savings And Business Benefits Of Microsoft Defender, Including Microsoft Sentinel SIEM Capabilities
A FORRESTER TOTAL ECONOMIC IMPACT STUDY COMMISSIONED BY Miscosoft, JuNE 2025
Total Economic Impact
A FORRESTER TOTAL ECONOMIC IMPACT STUDY COMMISSIONED BY Miscosoft, JuNE 2025


As cyberthreats escalate for enterprises, security operations (SecOps) teams’ effectiveness hinges on the tools they use. Many SecOps teams face burnout, silos, and outdated systems, eroding cyber resilience. To empower teams, their foundational SecOps tools need to employ automation and AI to reduce alert fatigue, foster collaboration, and enable agile, engineering-driven security practices. With the speed, scale, and sophistication of rising threats like GenAI, organizations that invest in the right tooling will mitigate risk and build a future-ready, resilient cybersecurity posture.
Microsoft Defender empowers organizations to anticipate and stop attacks with AI-driven defense. Microsoft Defender unifies threat prevention, detection, and response for better protection that autonomously disrupts attackers and accelerates security operations. Building on the data lake, graph, and SIEM capabilities of the Sentinel platform, Microsoft Defender powers the security operations center (SOC) of the future with a unified analyst experience, predictive graphing with real-time posture insights, embedded adversary-level threat intel, and agentic assistance to accelerate security operations.
Microsoft commissioned Forrester Consulting to conduct a Total Economic Impact™ (TEI) study and examine the potential return on investment (ROI) enterprises may realize by deploying Microsoft Defender.1 The purpose of this study is to provide readers with a framework to evaluate the potential financial impact of Microsoft Defender on their organizations.
To better understand the benefits, costs, and risks associated with this investment, Forrester interviewed four decision-makers with experience using Microsoft Defender. For the purposes of this study, Forrester aggregated the experiences of the interviewees and combined the results into a single composite organization, which is a retail organization with 10,000 FTEs and annual revenue of $5 billion.
Interviewees said that before using Microsoft Defender, the significant volume of threats they faced, including ransomware, phishing, and attacks against cloud infrastructure, were overwhelming to the team, and it was hard to build cyber resiliency. The proliferation and complexity of the existing toolset resulted in poor visibility into cross-domain threats, added drag to response efforts, and made it nearly impossible to strategically bolster security posture. Interviewees noted that their organizations would need additional, costly security operations center (SOC) engineering expertise in order to properly equip their SecOps team and harden their environment.
After the investment in Microsoft Defender, the interviewees reported on time savings from across the incident response spectrum, clocking shorter mean times to acknowledge, investigate, triage, and remediate altogether. Native integrations automatically correlated signals, providing better out-of-the-box context, more rapid alert prioritization, and fewer false positives. By transforming how they identified, prioritized, and responded to risk, interviewees said that Microsoft Defender helped their organizations establish a more resilient security posture with broader visibility, and it could reduce impacts of a breach should one occur. In particular, they noted faster response times, streamlined containment and response, reduced manual effort, and improved SLA adherence. Moreover, mean time to acknowledge (MTTA) dropped from 30 minutes to 15 minutes and mean time to resolve (MTTR) shrank from up to 3 hours to less than 1 hour in many cases.
Quantified benefits. Three-year, risk-adjusted present value (PV) quantified benefits for the composite organization include:
Reduced costs by 60% from vendor consolidation. Microsoft Defender with its Sentinel SIEM allows the composite to decommission legacy agents installed on physical appliances, as well as additional on-premises hardware and software licenses. It also saves on data ingestion and consumption costs, and it reduces internal and external costs to manage, patch, and maintain multicloud security vendor products. As a result, the composite saves $12 million in multicloud security costs.
Reduced incident response effort by 80%. With Microsoft Defender, the composite experiences a more consistent and controlled security environment, allowing teams to shift from reactive firefighting to proactive security operations. With fewer false positives; more actionable alerts; and less time spent on triage, investigations, and issue resolution, the composite experiences SecOps optimization benefits totaling $2.4 million.
Decreased SOC engineering costs with improved automation capabilities. Microsoft Defender allows the composite to engineer sophisticated, time-saving workflows that eliminate the need for specialized coding skills and reduce dependency on external contractors. Ultimately, the SOC engineers can operate with greater agility, precision, and efficiency — reducing operational overhead by $513,000 while delivering stronger security detections.
Reduced exposure to breach costs from external attacks by 75%. By consolidating siloed systems into Microsoft Defender, the composite organization gains real-time visibility into its risk landscape, enabling faster, more accurate threat detection and response and dramatically reducing the likelihood and impact of breaches. Enhanced automation, data correlation, and proactive threat hunting empower security teams to act decisively, cutting costs associated with incident response and minimizing dwell time, helping the composite reduce breach impacts by $2.8 million.
Unquantified benefits. Benefits that provide value for the composite organization but are not quantified for this study include improvements to security and IT team culture and relationships.
Costs. Three-year, risk-adjusted PV costs for the composite organization include:
Microsoft Defender and Sentinel SIEM license fees. Costs include Microsoft Defender For Cloud and E5 security licenses for 10,000 FTEs. The composite ingests 1 TB of security data per day into Sentinel in Year 1, then it scales to 2 TB in Year 3 and keeps 25% of the data in auxiliary logs. Altogether, Microsoft Defender’s unified SecOps platform costs $5.1 million for the composite.
A three-month deployment and training phase. The composite begins its deployment with Sentinel then slowly and steadily adds other capabilities. It takes the composite organization six months to deploy the full platform and gave security resources initial and ongoing training. Over three years, deployment and training costs total $109,000 for the composite.
Administration. The composite dedicates up to 2 hours per month to ongoing management of Microsoft Defender, totaling $20,000.
The financial analysis that is based on the interviews found that a composite organization experiences benefits of $17.8 million over three years versus costs of $5.2 million, adding up to a net present value (NPV) of $12.6 million and an ROI of 242%.
Reduction in incident response effort with Microsoft Defender
Return on investment (ROI)
Benefits PV
Net present value (NPV)
Payback
As the command center of cybersecurity defense, today’s SOC reckons with a barrage of modern and emerging threats. Many security teams operate in silos that hinder communication, delay response times, and increase the likelihood of oversight. This results in fragmented responsibilities, poor collaboration, and other challenges for:
SecOps analysts. Analysts spend too much time fighting the gaps in their existing tools, leaving little time for strategic thinking or proactive threat hunting. Many SOCs are bogged down by outdated, monolithic software and lack the agility to adapt to and get ahead of evolving threats.
SOC engineers. Detection engineers, the linchpins of the SOC, are often under-resourced and overburdened in their efforts to build and maintain detection rules. The absence of automation, agile workflows, and detection-as-code practices makes detection coverage inconsistent and difficult to scale.
Without the right tools to streamline detection, investigation, and response, security teams are stuck on a hamster wheel: constantly reacting but rarely innovating. As cyberthreats grow in complexity and frequency, security professionals increasingly deal with burnout, toxicity, and disengagement. When security teams lack unified tools and shared visibility, they become less effective and more prone to internal conflict. The resulting security team toxicity can weaken the organization’s overall security posture with cascading impacts such as:
More breaches. Forrester research reveals that emotionally detached security staff often face overwhelming workloads with insufficient tooling. As a result, toxic security teams are nearly three times more likely to experience internal incidents and slightly more likely to face external attacks.2
Base: 36 to 1,542 security decision-makers who have experienced a breach in the past 12 months; base size varies by segment
Source: Forrester’s Security Survey, 2024
Higher breach costs. Security breaches are more frequent and more expensive when incident response teams are unprepared. Forrester’s 2023 survey shows that organizations lacking adequate incident response preparation spend an average of $204,000 more per breach and suffer nearly one additional breach annually. This underscores the importance of well-integrated, well-equipped SecOps teams that can act swiftly and decisively.3
Base: 888 (all) and 140 (lacks adequate incident and crisis response preparation) global security decision-makers with network, data center, app security, or SecOps responsibilities who have experienced a breach in the past 12 months
*Base: 1,166 (all) and 168 (lacks adequate incident and crisis response preparation) global security decision-makers with network, data center, app security, or SecOps responsibilities
Source: Forrester’s Security Survey, 2023
Higher turnover on security teams. The global cybersecurity workforce gap means that existing staff must do more with less. Unfortunately, many security professionals are trained on specific products rather than core security principles. This product-centric training limits their ability to adapt and innovate, especially when tools are not intuitive or lack interoperability. To address this, organizations must invest in tools that automate routine tasks and empower analysts to learn, grow, and meaningfully contribute. Tools should support the full detection and response lifecycle, from triage to resolution, and provide opportunities for junior analysts to gain hands-on experience. This approach transforms the SOC from a burnout pipeline into a talent development engine.
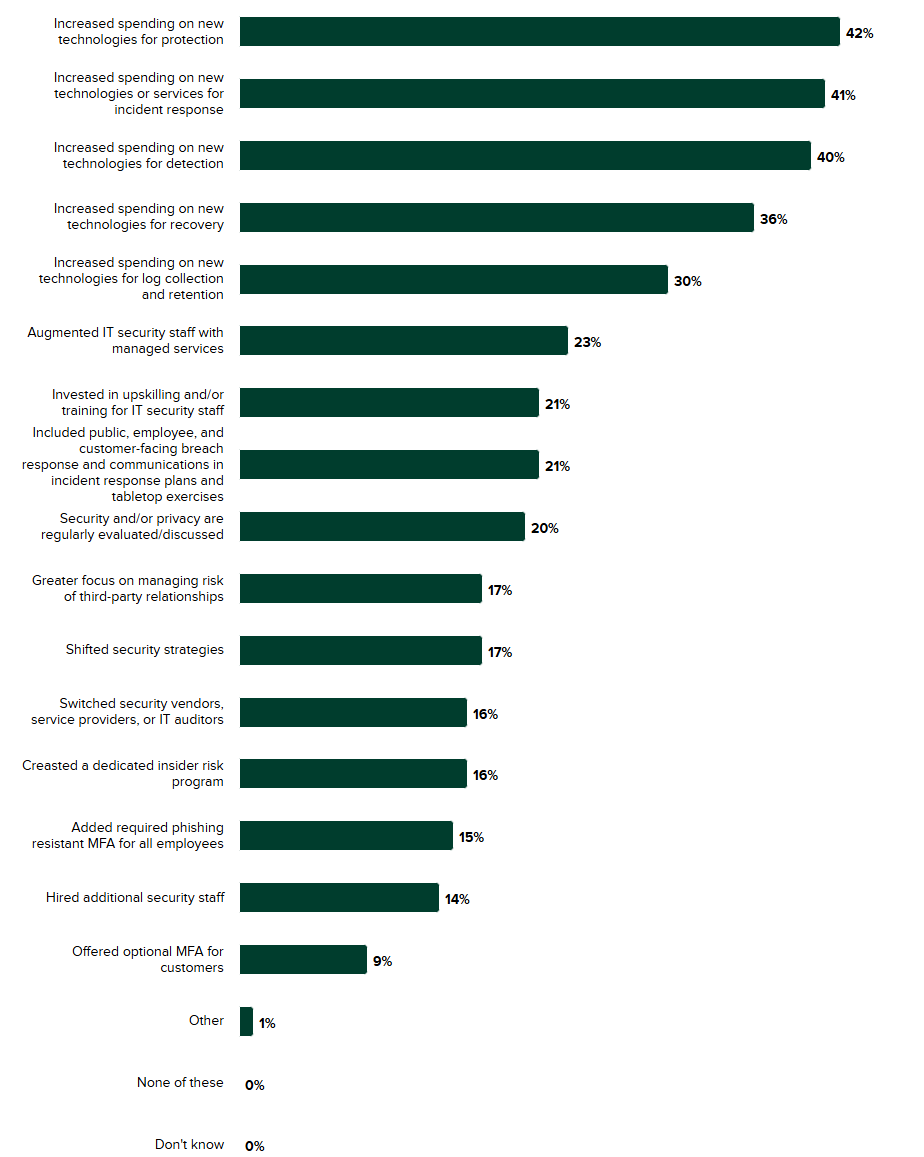
Increased tool proliferation without effective security team adoption. According to Forrester’s The State Of Application Security, 2025 and our Technographics® data, organizations continue to see a correlation between the number of reported breaches and expected budget increases for cybersecurity tools. Leading investment priorities included tools for protection, detection, and recovery, as well as other technologies and services for incident response.
 Increased spending on new technologies for protection
Increased spending on new technologies or services for incident response
Increased spending on new technologies for detection
Increased spending on new technologies for recovery
Increased spending on new technologies for log collection and retention
Augmented IT security staff with managed services
Invested in upskilling and/or training for IT security staff
Included public, employee, and customer-facing breach response and communications in incident response plans and tabletop exercises
Security and/or privacy are regularly evaluated/discussed
Greater focus on managing risk of third-party relationships
Shifted security strategies
Switched security vendors, service providers, or IT auditors
Creasted a dedicated insider risk program
Added required phishing resistant MFA for all employees
Hired additional security staff
Offered optional MFA for customers
Other
None of these
Don't know
Increased spending on new technologies for protection
Increased spending on new technologies or services for incident response
Increased spending on new technologies for detection
Increased spending on new technologies for recovery
Increased spending on new technologies for log collection and retention
Augmented IT security staff with managed services
Invested in upskilling and/or training for IT security staff
Included public, employee, and customer-facing breach response and communications in incident response plans and tabletop exercises
Security and/or privacy are regularly evaluated/discussed
Greater focus on managing risk of third-party relationships
Shifted security strategies
Switched security vendors, service providers, or IT auditors
Creasted a dedicated insider risk program
Added required phishing resistant MFA for all employees
Hired additional security staff
Offered optional MFA for customers
Other
None of these
Don't know
Base: 1,701 Security decision-makers who have experienced a breach in the past 12 months
Source: Forrester's Security Survey, 2024
When an organization experiences a breach, security leaders typically see a windfall in budget and buy-in from boards and executives. This allows them to shore up program gaps uncovered during the incident response (IR) process — or gaps that were previously surfaced and documented but not remediated. Regardless of when a gap was exposed, how it’s addressed is often an indication of incident readiness and the overall maturity of the incident response program. Forrester’s Security Survey, 2023, identified distinct challenges depending on organization size:
For lower-budget security programs, challenges included complexity in their IT environment, lack of comprehensive IT asset visibility, and an inability to measure the effectiveness of their security program.
Respondents in the higher-budget segment commonly reported that the changing and evolving nature of IT threats stood out; they also cited the complexity of their IT environment and too many false-positive detection alerts.
Regulatory bodies and customers are matching the steady increase of breach volume and cost with global increases in breach disclosure mandates, data privacy laws, and class action lawsuits. Additionally, cyber insurance carriers are increasing requirements for incident readiness attestations and scrutinizing firms’ security tech stacks after waves of zero-day vulnerabilities in security tools led to a tsunami of breaches. Organizations that decreased their IT security budget from 2022 to 2023 suffered the consequences. Forrester’s Security Survey, 2023, found that across all five incident alert/response steps, firms that increased their IT budgets for security saw shorter average times to complete those steps.
As breaches and breach costs increase, organizations must do more than throw tech and services at the problem. To increase incident response and readiness maturity, firms must invest in the internal staff and processes behind the tech and supporting services. Effective tools are force multipliers that enhance visibility, streamline workflows, and reduce burnout, empowering security teams to move from isolated and reactive firefighting to proactive, integrated defense.4
| Role | Industry | Region | SecOps FTEs |
|---|---|---|---|
| IT security architect | Legal | North America | 8 |
| Manager of cyberdefense | Consumer packaged goods (CPG) | Asia Pacific | 6 |
| Cyberdefense leader | Oil and gas | Asia Pacific | 17 |
| Chief information security officer (CISO) | Financial services |
North America headquarters; global operations |
15 |
Prior to implementing Microsoft Defender, interviewees described how their organizations had proactively upgraded their security investments to keep pace with evolving threats over the years. While they generally had intermediate cybersecurity maturity and were moving toward a more mature posture, their organizations still struggled with common challenges, including:
Excess costs, complexity, and risk from security tool proliferation. Interviewees described how their organizations rapidly expanded into complex, hybrid and multicloud environments that lacked overall visibility, making it difficult to understand their exposure, how attackers could exploit them, and ultimately, how to secure them. The legacy on-premises infrastructure required excess overhead to manage, with complex workflows and high data consumption fees.
Incident response drag. In most cases, interviewees came from organizations with many proactive security teams, including monitoring and incident response, threat intelligence and threat hunting, vulnerability management, identity and access management, and engineering and automation. These teams needed an array of tooling to keep up with the potential sources of an attack, which could cause a lack of visibility as well as alert fatigue. The high level of noise also led to a high false-positive rate for many of the interviewees’ organizations.
Mounting internal and external SOC engineering costs. Interviewees reported that their SOC engineering teams often lacked the advanced coding skills needed to build effective detections to address their organizations’ growing operational complexities and expanding attack surfaces. They noted, however, that contracting with third-party consultants to automate the needed detections would be cost-prohibitive.
A multitude of risks potentially leading to breaches and associated costs. Interviewees presented a range of cyberthreats their teams encountered with top vectors including ransomware and phishing. Some organizations had experienced a major breach in their prior environments, while others discussed how a potential breach would have an impact on their organizations’ profitability.
Several of the interviewees’ organizations conducted a proof-of-value phase in which they compared various SecOps platforms before deciding on an investment. Evaluation criteria included the analyst user experience and ease of use for various functionalities, the solutions’ respective false-positive rates, etc. Interviewees said that their organizations selected Microsoft Defender over other considerations because it could help to:
Scale securely without complexity. The interviewees’ organizations were experiencing rapid organizational growth and digital transformation. Alongside this process, they sought better technical capabilities and integrations to ensure that their companies expanded securely. Interviewees discussed how Microsoft Defender and Sentinel offered better integrations both with Microsoft collaboration, data center, and security products and other third-party tools.
Reduce analyst effort and improve experience. Analyst experience was one of the key criteria for selecting Microsoft Defender. Interviewees said that it had a more cohesive experience and provided better context and visibility, making more data available to SecOps analysts with fewer steps to insights. This was important to the organizations’ investment objectives to limit alerts needing a response and to help avoid alert fatigue that could allow for a breach.
Improve technical SOC engineering expertise without adding internal or external costs. Interviewees noted that Microsoft Defender rated higher than similar solutions in a proof-of-value phase. Interviewees shared how it was easier to build sophisticated workflows without advanced SOC engineering expertise in Microsoft Defender.
Mitigate the risk and related costs of a breach. With better ingestion of a range of data sources, interviewees noted that Microsoft Defender allowed their teams to improve visibility to reduce security gaps and manage exposures.
Based on the interviews, Forrester constructed a TEI framework, a composite company, and an ROI analysis that illustrates the areas financially affected. The composite organization is representative of the interviewees’ organizations, and it is used to present the aggregate financial analysis in the next section. The composite organization has the following characteristics:
Description of composite. The global organization generates $5 billion in annual revenue and invests 0.2% of revenue into its cybersecurity technology. The organization provides sales, customer support, and service/warranty support for its consumer products in high volume. The composite has 10,000 FTEs. It has a broad security function, including 10 SecOps analysts and one SOC engineer.
Deployment characteristics. The composite organization begins using Microsoft Defender in Year 1, following a three-month deployment period. In Year 1, the composite ingests 1 TB of data. This increases to 1.5 TB in Year 2 and 2 TB in Year 3.
$5 billion revenue
10,000 FTEs
10 SecOps analysts
1 SOC engineer
| Ref. | Benefit | Year 1 | Year 2 | Year 3 | Total | Present Value |
|---|---|---|---|---|---|---|
| Atr | Reduced costs from vendor consolidation | $4,110,653 | $5,024,131 | $5,480,870 | $14,615,654 | $12,006,991 |
| Btr | SecOps optimization | $876,096 | $1,010,880 | $1,078,272 | $2,965,248 | $2,442,011 |
| Ctr | Reduction in SOC engineering costs | $140,400 | $210,600 | $280,800 | $631,800 | $512,655 |
| Dtr | Reduced cost of material security breaches | $961,642 | $1,173,696 | $1,331,505 | $3,466,842 | $2,844,596 |
| Total benefits (risk-adjusted) | $6,088,790 | $7,419,307 | $8,171,447 | $21,679,545 | $17,806,253 |
Evidence and data. Interviewees detailed how their organizations were able to reduce a variety of costs from consolidating their multivendor security stack. Microsoft Defender allowed the organizations to decommission several other security vendor tools and save on data ingestion and consumption costs. Interviewees also reported lower managed security service provider (MSSP) fees for monitoring and less management required for the consolidated platform, with fewer internal FTEs to manage, patch, and maintain multicloud security vendor products. Interviewees provided additional insights into the value drivers for this benefit, including:
Internal and external cost reductions from vendor tool consolidation. The interviewees’ organizations streamlined their security operations by consolidating multiple vendor tools into Microsoft Defender, allowing their teams to harness more functionality with fewer tools as companies retired redundant solutions and simplified complex environments.
Lower SIEM costs. Multiple interviewees reported that their organizations reduced their data ingestion costs with Microsoft Defender’s Sentinel SIEM.
Modeling and assumptions. Based on the interviews, Forrester assumes the following about the composite organization:
In the prior environment, the composite organization’s multicloud cybersecurity budget is $10,000,000.
The composite dedicates one security resource to managing multiple vendor cybersecurity tools in the prior environment.
The average fully burdened annual salary of a SecOps resource is $149,760.
With Microsoft Defender, the composite decommissions several vendor tools, saves on data ingestion and consumption costs, and reduces internal and external costs to manage, patch, and maintain multicloud security vendor products. As a result, it decreases its multicloud cybersecurity spend by 45% in Year 1, 55% in Year 2, and 60% in Year 3.
Risks. The following risks may impact this benefit:
The number of workloads protected by Microsoft Defender.
The volume and cost of data ingestion in the prior environment.
The amount of internal labor and skill required to manage legacy security tools.
The fully burdened rates of SecOps resources.
Results. To account for these risks, Forrester adjusted this benefit downward by 10%, yielding a three-year, risk-adjusted total PV (discounted at 10%) of $12.0 million.
Reduction in multicloud cybersecurity spend with Microsoft Defender
| Ref. | Metric | Source | Year 1 | Year 2 | Year 3 | |
|---|---|---|---|---|---|---|
| A1 | Multicloud cybersecurity budget in the prior environment | Composite | $10,000,000 | $10,000,000 | $10,000,000 | |
| A2 | Security resources dedicated to managing cybersecurity tools in the prior environment | Interviews | 1 | 1 | 1 | |
| A3 | Average fully burdened annual salary for a SecOps resource | Composite | $149,760 | $149,760 | $149,760 | |
| A4 | Percentage reduction in multicloud cybersecurity budget with Microsoft Defender | Interviews | 45% | 55% | 60% | |
| At | Reduced costs from vendor consolidation | (A1+(A2*A3))*A4 | $4,567,392 | $5,582,368 | $6,089,856 | |
| Risk adjustment | ↓10% | |||||
| Atr | Reduced costs from vendor consolidation (risk-adjusted) | $4,110,653 | $5,024,131 | $5,480,870 | ||
| Three-year total: $14,615,654 | Three-year present value: $12,006,991 | |||||
Evidence and data. By consolidating the security environment, the interviewees noted how their organizations were able to fill security gaps, gain improved visibility into their technology estate, and improve the signal quality from alerts to reduce their false-positive and overall incident rates. SecOps teams reported significant improvements across the entire incident response lifecycle after adopting Microsoft Defender, with gains in speed, accuracy, and operational efficiency due to:
Lower incident rates. Interviewees pointed out several factors that contributed to reducing their organizations’ volume of security incidents. Microsoft’s well-integrated platform further reduced the risk of security tool misconfiguration. Interviewees described how automations in the unified experience helped reduce error and rework while being able to handle many individual alerts through a single automatic action.
Quicker detection of true threats. Threat detection became more proactive and precise thanks to integrated visibility across endpoints, identities, cloud services, and email. Teams could holistically assess risk, identifying threats with greater context and fewer false positives. The platform’s native integration with Microsoft tools also ensured that critical telemetry was available by default, without additional configuration.
More rapid investigations and triage of security incidents. Interviewees reported that their SecOps analysts saw major time savings thanks to Microsoft Defender’s unified views and enriched data from sources such as Intune and Entra ID. These insights allowed teams to quickly understand who was impacted, what assets were involved, and how incidents were related. What previously took up to 2 hours could now be triaged in as little as 10 minutes. Automation and correlation capabilities further accelerated this phase.
Faster overall response to incidents. Interviewees explained how Microsoft Defender streamlined containment and response, reduced manual effort, and improved SLA adherence, with MTTA dropping from 30 minutes to 15, and MTTR shrinking from up to 3 hours to less than 1 hour in many cases.
Modeling and assumptions. Based on the interviews, Forrester assumes the following about the composite organization:
The composite dedicates 10 SecOps analysts to security incident response.
With Microsoft Defender, the composite reduces the false-positive rate and overall incident rate, and it is able to conduct more rapid investigations and triage of security incidents. Time savings across the incident resolution spectrum with Microsoft’s unified SecOps platform helps the composite to reduce incident response effort by 65% in Year 1, 75% in Year 2, and 80% in Year 3.
The average fully burdened annual salary of a SecOps resource is $149,760.
Risks. The following risks may impact this benefit:
The number of threat alerts experienced annually and the number of alerts needing investigation and response.
The current time to investigate and time to respond to each threat alert.
The fully burdened hourly rate of security professionals and how this grows over time.
Results. To account for these risks, Forrester adjusted this benefit downward by 10%, yielding a three-year, risk-adjusted total PV (discounted at 10%) of $2.4 million.
Reduction in incident response effort with Microsoft Defender
| Ref. | Metric | Source | Year 1 | Year 2 | Year 3 | |
|---|---|---|---|---|---|---|
| B1 | Total SecOps analysts | Composite | 10 | 10 | 10 | |
| B2 | Percentage reduction in incident response effort with Microsoft Defender | Interviews | 65% | 75% | 80% | |
| B3 | Average fully burdened annual salary for a SecOps resource | A3 | $149,760 | $149,760 | $149,760 | |
| Bt | SecOps optimization | B1*B2*B3 | $973,440 | $1,123,200 | $1,198,080 | |
| Risk adjustment | ↓10% | |||||
| Btr | SecOps optimization (risk-adjusted) | $876,096 | $1,010,880 | $1,078,272 | ||
| Three-year total: $2,965,248 | Three-year present value: $2,442,011 | |||||
Evidence and data. Interviewees shared how their organizations significantly optimized their SOC engineering efforts with Microsoft Defender through a combination of automation, integration, and streamlined detection capabilities. Previously constrained by legacy SIEM tools that limited detection to specific data types, teams were able to expand their visibility and analytic reach across diverse data sources. This enabled them to build custom ingestion pipelines and normalize threat intelligence from multiple feeds using workflows that would have been cost-prohibitive to develop in the prior environment. Key value drivers for this benefit included:
Far-reaching and seamless integrations. The platform’s integration with identity and device management tools provided enriched context during investigations, with built-in capabilities like identifying device and login patterns. Previously, this level of insight would have been unattainable or would have required manual correlation and expensive additional staffing or specialized engineering.
Microsoft’s out-of-the-box detections. Interviewees emphasized how Microsoft Defender’s built-in detections made it easier to write and tune custom rules, further improving threat coverage. Compared to older platforms, the process was faster, more flexible, and less technically burdensome. Teams could proactively test and refine their defenses using frameworks like the MITRE ATT&CK Matrix, ensuring comprehensive coverage. This also helped some organizations to save on third-party contractor fees for security automation engineering.
Powerful, easy-to-deploy agile automations. Automation emerged as a major value driver. Tasks that once required advanced coding skills or external contractors were now achievable in-house using intuitive tools. This shift reduced reliance on costly external resources and accelerated the development of detection and response workflows.
Modeling and assumptions. Based on the interviews, Forrester assumes the following about the composite organization:
In the prior environment, the composite had one dedicated SOC engineer.
The composite is able to automate, integrate, and streamline detection with Microsoft Defender and Sentinel’s expanded analytic reach across diverse data sources. Without these capabilities, the composite would need to expand its SOC engineering capabilities by hiring two additional, higher-value SOC engineers to keep pace with cyberthreats.
The average fully burdened annual salary of a SOC engineer is $156,000.
Risks. The following risks may impact this benefit:
The number of security professionals needed for SOC engineering.
The frequency with which new detections are created and the time it takes to create them.
The number of new security professionals hired annually and the amount of time to onboard them.
Results. To account for these risks, Forrester adjusted this benefit downward by 10%, yielding a three-year, risk-adjusted total PV (discounted at 10%) of $513,000.
| Ref. | Metric | Source | Year 1 | Year 2 | Year 3 | |
|---|---|---|---|---|---|---|
| C1 | Total SOC engineers | Composite | 1 | 1 | 1 | |
| C2 | Reduction in SOC engineer new hires | Interviews | 1.0 | 1.5 | 2.0 | |
| C3 | Average fully burdened annual salary for a SOC engineer | Composite | $156,000 | $156,000 | $156,000 | |
| Ct | Reduction in SOC engineering costs | C2*C3 | $156,000 | $234,000 | $312,000 | |
| Risk adjustment | ↓10% | |||||
| Ctr | Reduction in SOC engineering costs (risk-adjusted) | $140,400 | $210,600 | $280,800 | ||
| Three-year total: $631,800 | Three-year present value: $512,655 | |||||
Evidence and data. With Microsoft Defender, interviewees shared how their organizations significantly reduced the cost and impact of material security breaches compared to their prior environment. By consolidating previously siloed systems into a single, integrated environment, security teams gained real-time visibility into endpoints, networks, and cloud assets. This holistic view allowed them to track the evolution of threats and vulnerabilities across the organization, enabling more accurate risk assessments and faster prioritization of remediation efforts. Interviewees specifically noted that their organizations’ security teams:
Improved their decision-making in response to incidents. The platform’s ability to correlate data from multiple sources — such as endpoint detections, application whitelisting tools, and vulnerability scanners — empowered teams to determine whether a vulnerability had been exploited, rather than relying on isolated indicators. This level of insight, combined with automation capabilities, allowed for immediate response actions like blocking malicious files or resetting compromised credentials, significantly reducing incident rates and dwell time.
Enhanced their threat-hunting abilities. Organizations enhanced their threat-hunting capabilities by consolidating data from a variety of sources into a unified platform, enabling analysts to identify patterns and anomalies with greater speed and accuracy. With simplified workflows and automation tools, teams were freed from manual tasks, allowing them to proactively investigate threats and engage in deeper, more strategic security analysis.
Strengthened overall security posture. Interviewees pointed out that their organizations were better protected with Microsoft Defender, often reporting measurable improvements in coverage. Furthermore, they shared that their security teams were more empowered, with the time and tools to engage in deeper threat analysis and collaborative security exercises. This shift ultimately translated into lower risk, fewer breaches, and a more efficient and effective SOC.
Modeling and assumptions. Based on the interviews, Forrester assumes the following about the composite organization:
The likelihood of experiencing a breach is estimated at 68%, and 90% of breaches originating from external attacks targeting organizations, external attacks targeting remote environments, internal incidents, or attacks or incidents involving the external ecosystem are considered addressable by Microsoft Defender.5
Based on Forrester’s data for organizations with $5 billion to $10 billion in revenue, the cumulative cost of breaches for the composite organization is $3.8 million.6
The reduction in risk exposure due to Microsoft Defender improves from 65% in Year 1 to 75% in Year 3.
Risks. The following risks may impact this benefit:
The frequency and cost of material breaches.
The current productivity cost of material breaches to the employee base.
Results. To account for these risks, Forrester adjusted this benefit downward by 15%, yielding a three-year, risk-adjusted total PV (discounted at 10%) of $2.8 million.
Reduced risk of exposure to breach costs from external attacks with Microsoft Defender
| Ref. | Metric | Source | Year 1 | Year 2 | Year 3 | |
|---|---|---|---|---|---|---|
| D1 | Likelihood of experiencing one or more breaches for the composite | Forrester research | 68% | 68% | 68% | |
| D2 | Percentage of breaches originating from external attacks targeting organizations, external attacks targeting remote environments, internal incidents, or attacks or incidents involving the external ecosystem | Forrester research | 90% | 90% | 90% | |
| D3 | Cumulative cost of breaches for the composite | Forrester research | $3,792,000 | $3,792,000 | $3,792,000 | |
| D4 | Percentage of organization secured by Microsoft Defender | Composite | 75% | 85% | 90% | |
| D5 | Annual risk exposure addressable with Microsoft Defender | D3*D1*D2*D4 | $1,740,528 | $1,972,598 | $2,088,634 | |
| D6 | Reduced risk of exposure to breach costs from addressable attacks with Microsoft Defender | Interviews | 65% | 70% | 75% | |
| Dt | Reduced cost of material security breaches | D5*D6 | $1,131,343 | $1,380,819 | $1,566,476 | |
| Risk adjustment | ↓15% | |||||
| Dtr | Reduced cost of material security breaches (risk-adjusted) | $961,642 | $1,173,696 | $1,331,505 | ||
| Three-year total: $3,466,842 | Three-year present value: $2,844,596 | |||||
Interviewees mentioned the following additional benefits that their organizations experienced but were not able to quantify:
Improvements to IT team culture and relationships. Interviewees noted that their security and IT teams were able to collaborate better and more easily on Microsoft Defender, whereas in the prior environment, they said that they would need to involve different product owners. In the unified platform, there were fewer product owners to collaborate with, resulting in fewer meetings and helping to build trust across departments.
The value of flexibility is unique to each customer. There are multiple scenarios in which a customer might implement Microsoft Defender and later realize additional uses and business opportunities, including:
Time savings reallocated to higher-value activities. Overall, Microsoft Defender empowered teams to detect, investigate, and respond to threats faster and more effectively, while simplifying operations and reducing tool sprawl. The platform’s unified experience and automation reduced rework and enabled faster return to normal operations. With the time saved, teams could focus on reducing technical debt and performing higher-value tasks rather than repetitive manual processes, improving security as well as morale and productivity.
Reduced onboarding time for SecOps analysts. Some interviewees noted that Microsoft Defender’s unified platform made it easier for new hires to grasp the environment, enabling them to more quickly contribute productive work than they could in the prior environment.
Flexibility would also be quantified when evaluated as part of a specific project (described in more detail in Total Economic Impact Approach).
| Ref. | Cost | Initial | Year 1 | Year 2 | Year 3 | Total | Present Value |
|---|---|---|---|---|---|---|---|
| Etr | Microsoft Defender and Sentinel SIEM | $0 | $1,698,510 | $2,059,365 | $2,435,070 | $6,192,945 | $5,075,559 |
| Ftr | Deployment and training | $51,005 | $33,451 | $22,687 | $11,923 | $119,066 | $109,123 |
| Gtr | Administration | $0 | $5,702 | $7,920 | $11,405 | $25,027 | $20,298 |
| Total costs (risk-adjusted) | $51,005 | $1,737,664 | $2,089,972 | $2,458,398 | $6,337,039 | $5,204,980 |
Microsoft Defender And Sentinel SIEM
Evidence and data. Microsoft Defender is an amalgamation of three Microsoft security products, each with different pricing models: Microsoft Sentinel, Microsoft 365 Defender XDR, and Microsoft Defender For Cloud.
Microsoft Defender For Cloud offers complimentary policy, compliance, and asset management functionality to Azure customers. The ability to perform threat detection and management with Microsoft Defender For Cloud comes at a variable added cost depending on the number of servers, SQL instances, transactions, etc., on which an organization might need to run Defender For Cloud.
Microsoft Sentinel’s pricing is flexible and based on the amount of data ingested and stored on a monthly basis. Additionally, Sentinel does not require any on-premises hardware and has no contract lock-in.
Organizations that already have Microsoft 365 E5 licenses incur no incremental cost to deploy Defender XDR. In other cases, organizations will need to upgrade to an E5 security license and pay the associated marginal costs.
Pricing may vary. Contact Microsoft for additional details.
Modeling and assumptions. Based on the interviews, Forrester assumes the following about the composite organization:
The cost of Microsoft Defender For Cloud is $300,000 annually.
The composite is not currently a full E5 license holder but purchases 10,000 E5 security licenses for its knowledge workers.
The price of an E5 security license is $54.75 per year.
The composite ingests 1 TB of security data into Sentinel per day in Year 1, then scales to 1.5 TB per day in Year 2 and 2 TB in Year 3. All logs must be stored for 12 months. The composite keeps 25% of its data in auxiliary logs, which experience further discounts
Ingestion for Office 365 audit logs, Azure activity logs, and alerts from Microsoft Threat Protection solutions (all of which typically represent about 5% of total log volume) are free with Microsoft Defender.
Risks. The following risks may impact this cost:
The annual cost of Azure servers related to Microsoft Defender.
The annual cost of storage related to Microsoft Defender.
Whether the organization has already purchased full E5 licenses for its employees. In this case, the cost of the security platforms is included in that fee.
The amount of data ingested and the length of time that the data needs to be stored.
The region where the logs are ingested and stored.
Results. To account for these risks, Forrester adjusted this cost upward by 10%, yielding a three-year, risk-adjusted total PV (discounted at 10%) of $5.1 million.
| Ref. | Metric | Source | Initial | Year 1 | Year 2 | Year 3 |
|---|---|---|---|---|---|---|
| E1 | Microsoft Defender for Cloud | Composite | $300,000 | $300,000 | $300,000 | |
| E2 | E5 security licenses purchased | Composite | 10,000 | 10,000 | 10,000 | |
| E3 | Cost per license | Microsoft | $54.75 | $54.75 | $54.75 | |
| E4 | Subtotal: Cost of Microsoft 365 Defender | E2*E3 | $547,500 | $547,500 | $547,500 | |
| E5 | Logs ingested (daily average TB) | Composite | 1 | 1.5 | 2 | |
| E6 | Microsoft Sentinel costs | Composite | $696,600 | $1,024,650 | $1,366,200 | |
| E7 | Cost to ingest Microsoft logs (activities, Office 365, Microsoft security alerts, etc.) | Free with Azure Sentinel | $0 | $0 | $0 | |
| E8 | Subtotal: Cost of Sentinel | E6 | $696,600 | $1,024,650 | $1,366,200 | |
| Et | Microsoft Defender And Sentinel SIEM | E1+E4+E8 | $1,544,100 | $1,872,150 | $2,213,700 | |
| Risk adjustment | ↑10% | |||||
| Etr | Microsoft Defender And Sentinel SIEM (risk-adjusted) | $0 | $1,698,510 | $2,059,365 | $2,435,070 | |
| Three-year total: $6,192,945 | Three-year present value: $5,075,559 | |||||
Evidence and data. Generally, the interviewees indicated that their organizations started their deployments with Sentinel, then slowly and steadily added other capabilities. Their organizations took between three and six months to deploy their Sentinel and XDR solutions, with efficiencies gained during successive deployments.
The interviewees’ organizations either incurred internal time costs associated with the deployment and implementation of Microsoft Defender, or they utilized a professional services provider. Microsoft provided the training materials to the interviewees for free, so the only training costs were for employee time spent training. Interviewees also pointed out how the consolidated deployment of Microsoft Defender required less analyst training and proved to have better time to value than did many tools.
The IT security architect at the legal firm noted that their organization preferred Microsoft’s simpler interface, which was easy to integrate and automate with their cloud apps. They said, “You can import stuff with just a few clicks, and you click Install and it will go and bring in templates for whatever you need.”
Modeling and assumptions. Based on the interviews, Forrester assumes the following about the composite organization:
The composite dedicates 520 hours to deployment in the initial three-month period. As it decommissions legacy tools and adds new functionality and integrations to Microsoft Defender, it dedicates an additional 260 hours to deployment in Year 1, and 130 hours in Year 2.
The average fully burdened hourly rate of a security resource is $72.
Twelve security resources require 8 hours of training in the initial period and 12 hours of ongoing training annually in Years 1 through 3.
Risks. The following risks may impact this cost:
The choice to use a partner or internal resources.
The size of the organization, its current on-premises environment, and its presence in the cloud.
Results. To account for these risks, Forrester adjusted this cost upward by 15%, yielding a three-year, risk-adjusted total PV (discounted at 10%) of $109,000.
| Ref. | Metric | Source | Initial | Year 1 | Year 2 | Year 3 |
|---|---|---|---|---|---|---|
| F1 | Deployment time (hours) | Interviews | 520 | 260 | 130 | 0 |
| F2 | Fully burdened hourly rate for a security resource | Composite | $72 | $72 | $72 | $72 |
| F3 | Subtotal: Deployment | F1*F2 | $37,440 | $18,720 | $9,360 | $0 |
| F4 | Time required for initial training (hours) | Interviews | 8 | 0 | 0 | 0 |
| F5 | Time required for annual ongoing training (hours) | Interviews | 0 | 12 | 12 | 12 |
| F6 | Security professionals trained | Composite | 12 | 12 | 12 | 12 |
| F7 | Subtotal: Training | F2*((F4+F5)*F6) | $6,912 | $10,368 | $10,368 | $10,368 |
| Ft | Deployment and training | F3+F7 | $44,352 | $29,088 | $19,728 | $10,368 |
| Risk adjustment | ↑15% | |||||
| Ftr | Deployment and training (risk-adjusted) | $51,005 | $33,451 | $22,687 | $11,923 | |
| Three-year total: $119,066 | Three-year present value: $109,123 | |||||
Evidence and data. The interviewees also noted minimal internal time costs associated with ongoing management of the solution, requiring approximately 8 to 10 hours of monthly management and tuning.
Modeling and assumptions. Based on the interviews, Forrester assumes the following about the composite organization:
The composite dedicates 72 hours of internal labor to ongoing management in Year 1. This grows to 100 hours in Year 2 and 144 hours in Year 3 as the composite integrates further data sources into the environment.
The average fully burdened hourly rate of a security resource is $72.
Risks. The following risks may impact this cost:
The number of employees administering the solution.
The size of the organization and the extent of coverage of Microsoft Defender.
Results. To account for these risks, Forrester adjusted this cost upward by 10%, yielding a three-year, risk-adjusted total PV (discounted at 10%) of $20,000.
| Ref. | Metric | Source | Initial | Year 1 | Year 2 | Year 3 |
|---|---|---|---|---|---|---|
| G1 | Ongoing management time (hours) | Interviews | 0 | 72 | 100 | 144 |
| G2 | Fully burdened hourly rate of an administrator | F2 | $72 | $72 | $72 | $72 |
| Gt | Administration | G1*G2 | $0 | $5,184 | $7,200 | $10,368 |
| Risk adjustment | ↑10% | |||||
| Gtr | Administration (risk-adjusted) | $0 | $5,702 | $7,920 | $11,405 | |
| Three-year total: $25,027 | Three-year present value: $20,298 | |||||
| Initial | Year 1 | Year 2 | Year 3 | Total | Present Value | |
|---|---|---|---|---|---|---|
| Total costs | ($51,005) | ($1,737,664) | ($2,089,972) | ($2,458,398) | ($6,337,039) | ($5,204,980) |
| Total benefits | $0 | $6,088,790 | $7,419,307 | $8,171,447 | $21,679,545 | $17,806,253 |
| Net benefits | ($51,005) | $4,351,127 | $5,329,335 | $5,713,049 | $15,342,506 | $12,601,273 |
| ROI | 242% | |||||
| Payback | <6 months |
The financial results calculated in the Benefits and Costs sections can be used to determine the ROI, NPV, and payback period for the composite organization’s investment. Forrester assumes a yearly discount rate of 10% for this analysis.
These risk-adjusted ROI, NPV, and payback period values are determined by applying risk-adjustment factors to the unadjusted results in each Benefit and Cost section.
The initial investment column contains costs incurred at “time 0” or at the beginning of Year 1 that are not discounted. All other cash flows are discounted using the discount rate at the end of the year. PV calculations are calculated for each total cost and benefit estimate. NPV calculations in the summary tables are the sum of the initial investment and the discounted cash flows in each year. Sums and present value calculations of the Total Benefits, Total Costs, and Cash Flow tables may not exactly add up, as some rounding may occur.
From the information provided in the interviews, Forrester constructed a Total Economic Impact™ framework for those organizations considering an investment in Microsoft Defender.
The objective of the framework is to identify the cost, benefit, flexibility, and risk factors that affect the investment decision. Forrester took a multistep approach to evaluate the impact that Microsoft Defender can have on an organization.
Interviewed Microsoft stakeholders and Forrester analysts to gather data relative to Microsoft Defender.
Interviewed four decision-makers at organizations using Microsoft Defender to obtain data about costs, benefits, and risks.
Designed a composite organization based on characteristics of the interviewees’ organizations.
Constructed a financial model representative of the interviews using the TEI methodology and risk-adjusted the financial model based on issues and concerns of the interviewees.
Employed four fundamental elements of TEI in modeling the investment impact: benefits, costs, flexibility, and risks. Given the increasing sophistication of ROI analyses related to IT investments, Forrester’s TEI methodology provides a complete picture of the total economic impact of purchase decisions. Please see Appendix A for additional information on the TEI methodology.
Benefits represent the value the solution delivers to the business. The TEI methodology places equal weight on the measure of benefits and costs, allowing for a full examination of the solution’s effect on the entire organization.
Costs comprise all expenses necessary to deliver the proposed value, or benefits, of the solution. The methodology captures implementation and ongoing costs associated with the solution.
Flexibility represents the strategic value that can be obtained for some future additional investment building on top of the initial investment already made. The ability to capture that benefit has a PV that can be estimated.
Risks measure the uncertainty of benefit and cost estimates given: 1) the likelihood that estimates will meet original projections and 2) the likelihood that estimates will be tracked over time. TEI risk factors are based on “triangular distribution.”
The present or current value of (discounted) cost and benefit estimates given at an interest rate (the discount rate). The PV of costs and benefits feed into the total NPV of cash flows.
The present or current value of (discounted) future net cash flows given an interest rate (the discount rate). A positive project NPV normally indicates that the investment should be made unless other projects have higher NPVs.
A project’s expected return in percentage terms. ROI is calculated by dividing net benefits (benefits less costs) by costs.
The interest rate used in cash flow analysis to take into account the time value of money. Organizations typically use discount rates between 8% and 16%.
The breakeven point for an investment. This is the point in time at which net benefits (benefits minus costs) equal initial investment or cost.
Total Economic Impact is a methodology developed by Forrester Research that enhances a company’s technology decision-making processes and assists solution providers in communicating their value proposition to clients. The TEI methodology helps companies demonstrate, justify, and realize the tangible value of business and technology initiatives to both senior management and other key stakeholders.
Related Forrester Research
Top Recommendations For Your Security Program, 2025, Forrester Research, Inc., March 6, 2025.
Eliminate Silos And Build An Unbreakable Alliance With Your Security Team, Forrester Research, Inc., September 11, 2023.
Evolve Your Product Security Team To Support Your Organization’s Modern And Future Fit Tech Strategies, Forrester Research, Inc., September 18, 2023.
The Cybersecurity Firefighter’s Guide To Controlling Burnout, Forrester Research, Inc., April 18, 2024.
The Top Cybersecurity Threats In 2025, Forrester Research, Inc., April 14, 2025.
Breaches Are More Expensive And More Frequent When Incident Response Teams Are Unprepared, Forrester Research, Inc., July 8, 2024.
Assess Your Security Program With Forrester’s Information Security Maturity Model (FISMM), Forrester Research, Inc., February 28, 2025.
Role Profile: Detection Engineer, Forrester Research, Inc., March 26, 2025.
Plan Your Critical Vulnerability Response, Forrester Research, Inc., October 17, 2024.
The State Of Cyber Insurance, 2024, Forrester Research, Inc., August 20, 2024.
1 Total Economic Impact is a methodology developed by Forrester Research that enhances a company’s technology decision-making processes and assists solution providers in communicating their value proposition to clients. The TEI methodology helps companies demonstrate, justify, and realize the tangible value of business and technology initiatives to both senior management and other key stakeholders.
2 Source: Security Team Toxicity Leads To More Breaches, Forrester Research, Inc., December 9, 2024.
3 Source: Breaches Are More Expensive And More Frequent When Incident Response Teams Are Unprepared, Forrester Research, Inc., Jul 07, 2024
4 Source: The State Of Incident Readiness And Response, 2024
5 Source: Regression analysis of the likelihood of experiencing one or more breaches, using the frequency that organizations experienced breaches in the past 12 months as reported by security decision-makers. The composite organization's revenue is used as the input to the regression formula. Source: Forrester's Security Survey, 2024, "How many times do you estimate that your organization's sensitive data was potentially compromised or breached in the past 12 months?" Base: 2,769 global security decision-makers
6 Source: Regression analysis of the reported total cumulative costs of all breaches experienced by security decision-makers' organizations in the past 12 months. The composite organization's revenue is used as the input to the regression formula. Source: Forrester's Security Survey, 2024, "Using your best estimate, what was the total cumulative cost of all breaches experienced by your organization in the past 12 months?" Base: 1,660 global security decision-makers who have experienced a breach in the past 12 months.
Readers should be aware of the following:
This study is commissioned by Microsoft and delivered by Forrester Consulting. It is not meant to be used as a competitive analysis.
Forrester makes no assumptions as to the potential ROI that other organizations will receive. Forrester strongly advises that readers use their own estimates within the framework provided in the study to determine the appropriateness of an investment in Microsoft Defender. For any interactive functionality, the intent is for the questions to solicit inputs specific to a prospect's business. Forrester believes that this analysis is representative of what companies may achieve with Microsoft Defender based on the inputs provided and any assumptions made. Forrester does not endorse Microsoft or its offerings. Although great care has been taken to ensure the accuracy and completeness of this model, Microsoft and Forrester Research are unable to accept any legal responsibility for any actions taken on the basis of the information contained herein. The interactive tool is provided ‘AS IS,’ and Forrester and Microsoft make no warranties of any kind.
Microsoft reviewed and provided feedback to Forrester, but Forrester maintains editorial control over the study and its findings and does not accept changes to the study that contradict Forrester’s findings or obscure the meaning of the study.
Microsoft provided the customer names for the interviews but did not participate in the interviews.
June 2025
ABOUT FORRESTER CONSULTING
Forrester provides independent and objective research-based consulting to help leaders deliver key transformation outcomes. Fueled by our customer-obsessed research, Forrester’s seasoned consultants partner with leaders to execute on their priorities using a unique engagement model that tailors to diverse needs and ensures lasting impact. For more information, visit forrester.com/consulting.
© Forrester Research, Inc. All rights reserved. Unauthorized reproduction is strictly prohibited. Information is based on best available resources. Opinions reflect judgment at the time and are subject to change. Forrester®, Technographics®, Forrester Wave, and Total Economic Impact are trademarks of Forrester Research, Inc. All other trademarks are the property of their respective companies.
https://mainstayadvisor.com/go/mainstay/gdpr/policy.html