



Executive Summary
Organizations increasingly rely on production data streaming to support critical applications, analytics, operational workflows, and AI agents.1 Forrester identifies streaming data platforms as a foundation for publish-and-subscribe and event-driven architectures, continuous processing, real-time analytics, and observability.2
Within IBM’s broader data and AI portfolio, Confluent provides a data streaming platform that connects with existing systems across hybrid environments and helps organizations process, govern, and make real-time data available across operational and analytical environments. In this study, Forrester quantifies only the areas where customer evidence and representative composite assumptions provide a defensible financial path: production data streaming use case delivery, platform engineering, avoided infrastructure and platform technology costs, high-severity incident response, and governance standardization.
Confluent, an IBM company, commissioned Forrester Consulting to conduct a Total Economic Impact™ (TEI) study of the potential return on investment (ROI) from selectively migrating workloads to Confluent Cloud, modernizing data streaming platforms, and expanding their use of Confluent.3 The study gives readers a framework for evaluating the potential financial impact on their organizations.
Key Statistics
137%
Return on investment (ROI)
$3.6M
Benefits PV
$2.1M
Net present value (NPV)
To better understand the benefits, costs, and risks associated with this investment, Forrester interviewed four decision-makers with experience using Confluent. Forrester aggregated their experiences into a representative composite organization, which is a global enterprise with approximately $20 billion in annual revenue, 25,000 employees, an established production data streaming environment, and a central data/platform function.
Before the migration, modernization, and expansion examined in this study, the interviewees’ organizations already operated complex production data streaming environments. These environments combined existing Confluent technology; self-managed Kafka; batch and extract, transform, and load (ETL) pipelines; point-to-point data movement; custom connectors; and manual platform and governance processes. Teams still faced high internal platform operations and enablement effort, inconsistent onboarding and governance, and ongoing incident and support burdens. These constraints slowed use case delivery, limited reuse, and increased reliance on specialized platform resources.
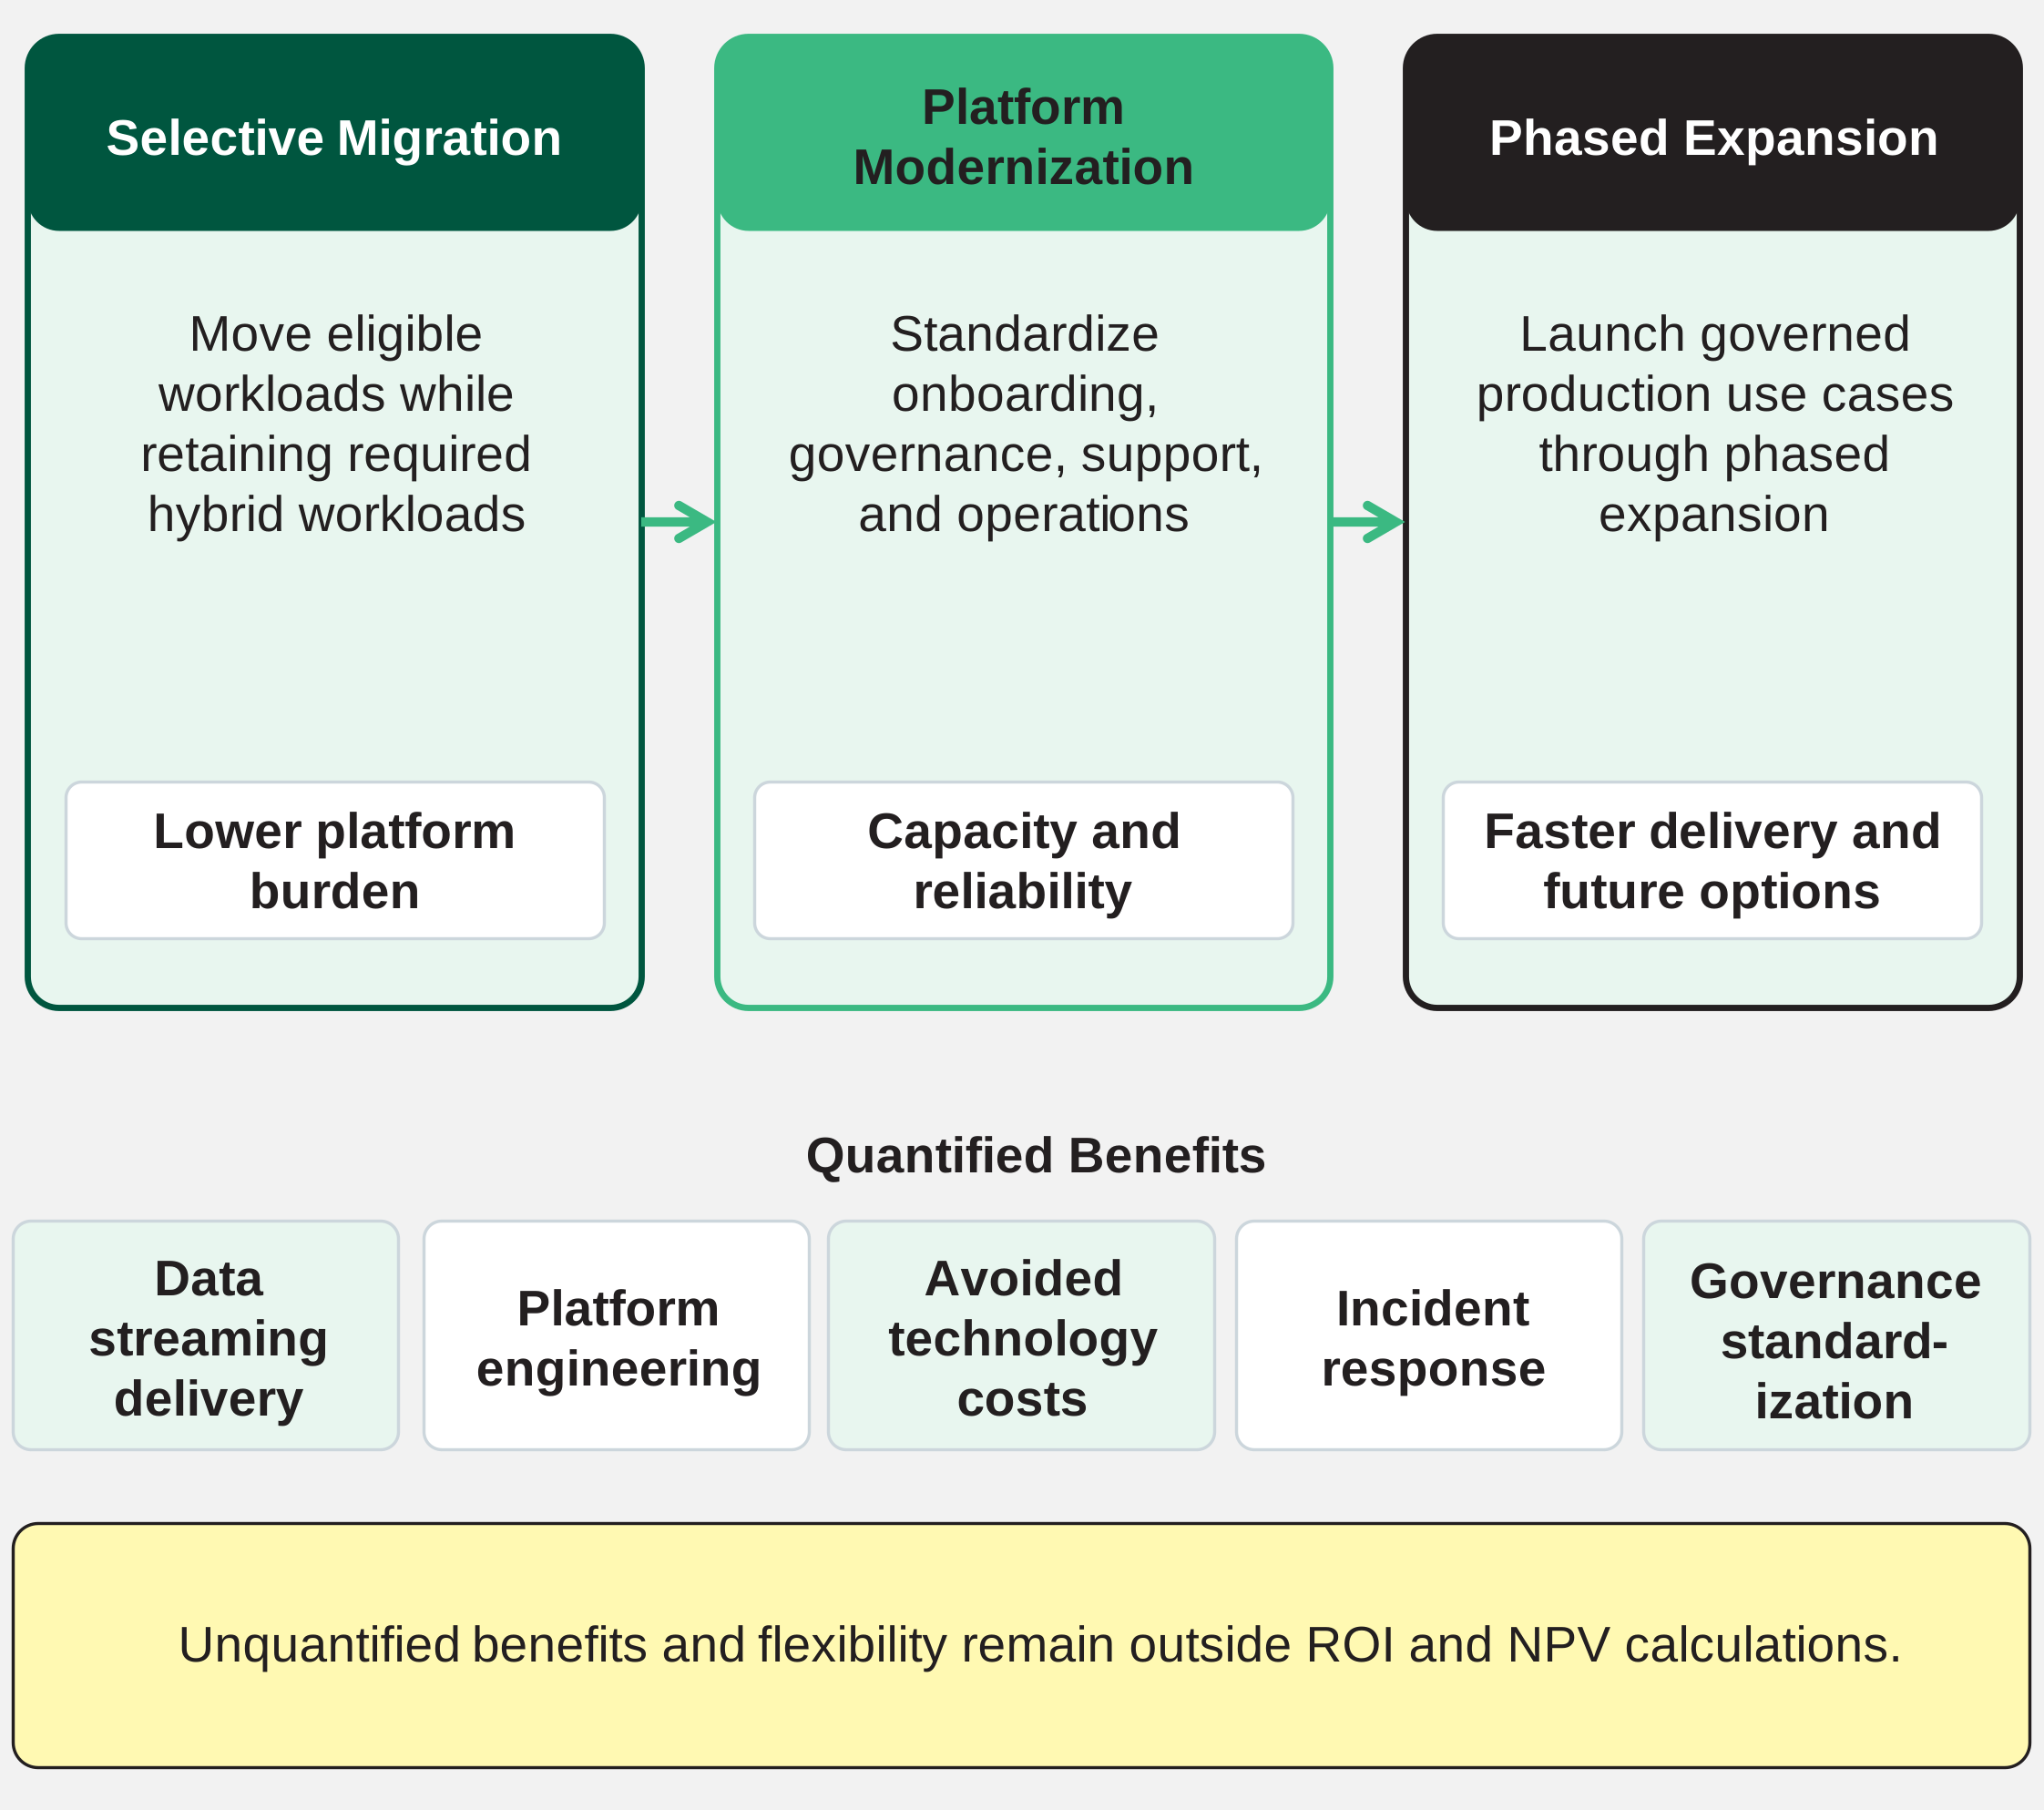
After their respective migrations to, modernization efforts for, and expansions of their use of Confluent, the organizations moved eligible workloads to managed services and standardized platform, onboarding, governance, and support patterns. They reported shorter use case delivery cycles, lower internal platform operations and enablement effort, fewer and shorter high-severity incidents, and more consistent governance.
Key Findings
Quantified benefits. Quantified benefits for the composite organization include:
-
Faster delivery of production data streaming use cases. The composite avoids 360 active technical delivery hours per new or materially updated production use case. It launches three use cases in Year 1, five in Year 2, and seven in Year 3.
-
Lower platform engineering effort. The composite reduces the annual platform operations and enablement requirement from 10.5 full-time employee equivalents (FTEs) to 3.5 FTEs. This recaptures the annual capacity equivalent to seven FTEs for other work or avoids future hiring as the platform expands.
-
Avoided infrastructure and platform technology costs. The composite has a $200,000 annual difference between eligible nonlabor platform costs in the prior and expanded states. It retires or avoids 75% of that difference in Year 1, 90% in Year 2, and 100% in Year 3.
-
Lower high-severity incident response effort. Annual high-severity incidents fall from 12 to four, responders per incident fall from eight to four, and active response time per responder falls from 8 hours to 2.5 hours.
-
Lower governance review and coordination effort. Standardized message, schema, access, and review patterns avoid 15 hours of formal governance review and coordination per new or updated production use case.
Unquantified benefits. Interviewees also described benefits that are not quantified in this study, including:
-
Reusable streaming data and simpler data movement. Interviewees described greater reuse of governed streams, fewer bespoke data paths, and less reliance on custom translation or specialized external support.
-
Reduced manual work and faster onboarding. Interviewees reported less data reconciliation and production data quality work, along with faster engineer onboarding and access provisioning.
-
Faster operational and customer response. Interviewees described faster detection, action, and customer-facing processing in selected workflows.
-
Greater trust and operational assurance. Interviewees reported more consistent message, schema, access, and governance patterns, improved traceability, and lower on-call burden.
Quantified costs. Quantified costs for the composite organization include:
-
Incremental Confluent spend. The composite incurs $620,000 in incremental Confluent spend before risk adjustment, including $150,000 in one-time professional services and $470,000 in incremental recurring spend associated with the phased expansion. The existing $1.0 million annual baseline continues in both states and is excluded from the incremental cost calculation.
-
Non-Confluent implementation and migration costs. The composite incurs approximately $850,000 before risk adjustment in one-time partner services and internal labor for architecture, networking, security, migration, testing, and production readiness.
Based on the interviews, the financial analysis found that the composite organization experiences risk-adjusted benefits with a present value of $3.6 million and costs with a present value of $1.5 million over three years, resulting in an NPV of $2.1 million and an ROI of 137%.
$3.6 million
Three-year, risk-adjusted present value of benefits from data streaming delivery, platform engineering, avoided technology costs, incident response, and governance standardization
Benefits (Three-Year)
The Confluent Customer Journey
Drivers leading to adoption and expanded use of Confluent
Interviews
| Role | Industry | Region | FY2025 Revenue |
|---|---|---|---|
| Vice president of product | Retail technology | Global |
$28 million to $42 million (estimated) |
| Senior vice president, architecture, and senior lead analyst | Financial services | Global | $85.2 billion |
| Senior director, data streaming platform | Hospitality | Global | $26.2 billion |
| Senior fellow, software engineering and platforms | Manufacturing | Global | €26.0 billion |
Key Challenges
Forrester interviewed four decision-makers at organizations using Confluent. The organizations operate globally and span hospitality, manufacturing, retail technology, and financial services. At the time of the interviews, all four organizations used Confluent for production data streaming. The initiatives they discussed began from different prior states: initial Confluent adoption, migration from self-managed streaming technologies, modernization of existing environments, or expansion of existing Confluent use.
Across these prior states, interviewees described common challenges, including:
-
Fragmented data movement and streaming patterns. Teams used self-managed Kafka, batch and ETL pipelines, point-to-point connections, and custom connectors. Multiple approaches made production onboarding, support, governance, and reuse harder to standardize.
-
High burden on platform operations and enablement. Teams spent time provisioning, scaling, patching, upgrading, monitoring, troubleshooting, and maintaining streaming infrastructure. They also devoted capacity to onboarding and training teams, answering platform questions, and helping application and domain teams adopt repeatable self-service patterns. The senior director, data streaming platform, at a hospitality organization said platform work once dominated the team’s attention, while the senior fellow, software engineering and platforms at a manufacturer described 13 to 14 people supporting self-managed Apache Kafka workloads before the cloud move.
-
Slow delivery of production use cases. New use cases required coordination across application, platform, infrastructure, security, architecture, and business teams. Interviewees reported lead times ranging from months to nearly a year before more repeatable patterns were in place.
-
Incident and reliability pressure. Prior environments could require several responders, long troubleshooting calls, and specialized technical support. Interviewees described outages, higher mean time to resolution, and substantial on-call burden.
-
Governance and message standardization friction. Some teams spent time coordinating access, reviews, message formats, and translation or broker patterns across systems. These controls were necessary, but inconsistent approaches increased effort.
-
Limited reuse and delayed data availability. Bespoke data paths and batch processes made it harder to reuse the same data across applications, analytics, and operational workflows. Periodic delivery also delayed action in workflows that needed fresher data.
Investment Objectives
The interviewees’ organizations adopted or expanded their use of Confluent to:
-
Scale production streaming without proportional increases in platform operations and enablement effort.
-
Improve the speed and consistency of launching production data streaming use cases.
-
Make onboarding and routine platform support more repeatable through reusable self-service patterns.
-
Support high-availability production workloads with lower incident and escalation burdens.
-
Standardize message, access, and governance-review patterns without slowing delivery.
-
Enable broader reuse of governed streams and data products across applications and downstream consumers.
Composite Organization
Based on the interviews, Forrester constructed a TEI framework, a composite company, and an ROI analysis that illustrates the areas financially affected. The composite organization is representative of the interviewees’ organizations, and it is used to present the aggregate financial analysis in the next section. The composite organization has the following characteristics:
-
Description of composite. The composite is a representative global enterprise with approximately $20 billion in annual revenue and 25,000 employees. It operates production data streaming workloads across multiple business and technology domains and has a central data/platform function supporting infrastructure, internal users, applications, and downstream consumers. The composite reflects customer evidence and Forrester judgment rather than a mathematical average of the four organizations.
-
Investment event. In the prior state, the composite continues its existing Confluent Platform, self-managed Kafka, and related technology footprint while meeting the same projected workload and use case growth. In the expanded state, it migrates selected workloads to Confluent Cloud, modernizes the data streaming platform, and expands managed data streaming capabilities while meeting the same projected demand.
-
Deployment characteristics. The composite launches three new or materially updated production data streaming use cases in Year 1, five in Year 2, and seven in Year 3. The $1.0 million annual Confluent spend that continues in both states is a common baseline for the incremental comparison; it is not an added cost of the expanded investment.
KEY ASSUMPTIONS
-
Approximately $20 billion in annual revenue
-
25,000 employees
-
$1.0 million in prior annual Confluent spend retained in both states
-
Three, five, and seven annual new or updated production data streaming use cases
-
Prior state: existing Confluent Platform, self-managed Kafka, and related technology under the same projected growth
-
Expanded state: selective cloud migration, platform modernization, and managed-capability expansion under the same projected growth
Analysis Of Benefits
Quantified benefit data as applied to the composite
Total Benefits
| Ref. | Benefit | Year 1 | Year 2 | Year 3 | Total | Present Value |
|---|---|---|---|---|---|---|
| Atr | Data streaming delivery efficiency | $80,919 | $134,865 | $188,811 | $404,595 | $326,878 |
| Btr | Platform engineering efficiency | $1,141,504 | $1,141,504 | $1,141,504 | $3,424,512 | $2,838,751 |
| Ctr | Avoided infrastructure and platform technology costs | $112,500 | $135,000 | $150,000 | $397,500 | $326,540 |
| Dtr | Incident response efficiency | $32,951 | $32,951 | $32,951 | $98,853 | $81,945 |
| Etr | Governance standardization efficiency | $2,481 | $4,135 | $5,789 | $12,404 | $10,022 |
| Total benefits (risk-adjusted) | $1,370,355 | $1,448,455 | $1,519,055 | $4,337,865 | $3,584,136 |
Data Streaming Delivery Efficiency
Evidence and data. Interviewees said that managed services and more repeatable platform patterns reduced infrastructure setup and bespoke engineering work, contributing to shorter delivery cycles for production data streaming use cases.
-
The senior fellow, software engineering and platforms, at a manufacturing organization described the delivery of a major change supporting the organization’s order-to-cash process: “Before, any change would have led to at least a nine-month lead time. Right now, it is 65 days.”
-
According to the senior director, data streaming platform, the hospitality organization reduced standard producer-to-consumer onboarding from roughly 4 to 5 months to a best case of 2 sprints and a worst case of 1 program increment.
-
Interviewees said production delivery still required coordination across application, platform, security, architecture, governance, and business teams.
Modeling and assumptions. Based on the customer-reported ranges, Forrester models the following for the composite organization:
-
For this analysis, a production data streaming use case is a new streaming workflow or a material change to an existing workflow that requires coordinated design, build, testing, and deployment before release to production. Routine maintenance and minor configuration changes are not counted as separate use cases.
-
The composite launches three new or materially updated production data streaming use cases in Year 1, five in Year 2, and seven in Year 3. Each use case involves five engineers. Forrester selects an elapsed cycle of 20 weeks in the prior state and 8 weeks in the expanded state, then translates those elapsed cycles into 120 active hours per engineer in the prior state and 48 active hours in the expanded state, equivalent to 6 active hours per engineer per week in each state. The difference across five engineers is 360 active delivery hours avoided per use case.
-
For modeling purposes, the five engineers represent the broader technical delivery group, and Forrester values their combined time using one consistent data engineer-equivalent hourly rate. This does not assume that every use case involves five people with identical job titles.
-
Forrester applies a fully burdened rate of $111 per data engineer hour and a 75% productivity recapture. Forrester values 75% of the avoided delivery time as productive capacity and leaves the remainder unquantified. The benefit includes active design, build, test, coordination, and deployment effort. It excludes platform operations and enablement, formal governance review, high-severity incident response, technology costs, revenue acceleration, and business value from faster decisions.
Risks. The scale of this benefit may vary from organization to organization based on:
-
The organization’s ability to identify and prioritize additional production data streaming use cases.
-
The complexity and configuration of the prior environment.
-
The maturity of reusable delivery, platform, and governance standards.
-
The skills and experience of the technical teams involved.
-
The organization’s ability to redirect avoided delivery time to productive work.
Results. Forrester applied a 10% downward adjustment to reflect differences in use case complexity, active engineering effort, team mix, and the ability to redirect time. This yields a three-year, risk-adjusted total PV (discounted at 10%) of $327,000.
360 hours
Active technical delivery effort avoided per new or updated production data streaming use case
Data Streaming Delivery Efficiency
| Ref. | Metric | Source | Year 1 | Year 2 | Year 3 | |
|---|---|---|---|---|---|---|
| A1 | Annual new or updated production data streaming use cases | Composite | 3 | 5 | 7 | |
| A2 | Data engineers per use case | Composite | 5 | 5 | 5 | |
| A3 | Prior state: Elapsed delivery cycle per use case (weeks) | Interviews | 20 | 20 | 20 | |
| A4 | Expanded state: Elapsed delivery cycle per use case (weeks) | Interviews | 8 | 8 | 8 | |
| A5 | Prior state: Active delivery time per data engineer per use case (hours) | Composite | 120 | 120 | 120 | |
| A6 | Expanded state: Active delivery time per data engineer per use case (hours) | Composite | 48 | 48 | 48 | |
| A7 | Active delivery hours avoided per use case | A2*(A5-A6) | 360 | 360 | 360 | |
| A8 | Fully burdened hourly rate for a data engineer | Composite | $111 | $111 | $111 | |
| A9 | Productivity recapture rate | TEI methodology | 75% | 75% | 75% | |
| At | Data streaming delivery efficiency | A1*A7*A8*A9 | $89,910 | $149,850 | $209,790 | |
| Risk adjustment | ↓10% | |||||
| Atr | Data streaming delivery efficiency (risk-adjusted) | $80,919 | $134,865 | $188,811 | ||
| Three-year total: $404,595 | Three-year present value: $326,878 | |||||
Platform Engineering Efficiency
Evidence and data. By moving eligible workloads to Confluent Cloud and standardizing support patterns, interviewees’ organizations reduced the internal effort required to operate and support their streaming platforms. Interviewees said this released platform operations and enablement capacity for other work.
-
The senior fellow, software engineering and platforms, at a manufacturing organization described support moving from approximately 13 to 14 people managing self-managed Apache Kafka before the cloud move to about two people supporting Confluent Cloud and about three people supporting retained, self-managed Apache Kafka clusters on-premises.
-
The senior director, data streaming platform, at a hospitality organization described reallocating platform capacity after Confluent assumed much of the operating work: “One pod is about seven to eight people. We reduced one pod because now, Confluent is running it for us.”
-
Interviewees also described greater self-service, fewer routine infrastructure-related questions, and at one organization, an approximately 50% decline in infrastructure-related support tickets.
Modeling and assumptions. Based on the interviews, Forrester models the following for the composite organization:
-
The composite requires platform operations and enablement capacity equivalent to 10.5 FTEs in the prior state and 3.5 FTEs in the expanded state. The recaptured annual capacity of seven FTEs comprises the equivalent of five platform operations FTEs and two enablement FTEs. The expanded state retains 3.5 FTEs for internal platform ownership, architecture, monitoring, vendor coordination, workload oversight, and continued user enablement.
-
For modeling purposes, platform operations and platform enablement professionals are role-equivalent labor categories representing the technical work performed rather than formal job titles.
-
Forrester applies a fully burdened rate of $98 per hour and 2,080 annual work hours per FTE. No separate partial productivity recapture is applied because the seven-FTE difference is defined as net annual capacity that can be reassigned or avoided, not gross task-hour efficiency. This treatment does not assume layoffs or direct payroll reductions. It excludes application delivery, formal governance review, high-severity incident response, and technology costs.
Risks. The scale of this benefit may vary from organization to organization based on:
-
The scale and complexity of the streaming environment, including hybrid and retained on-premises workloads.
-
The maturity of platform automation and self-service before the investment.
-
The skills and experience of internal platform personnel.
-
The division of operating responsibility across Confluent, customer teams, and service providers.
-
Growth in platform use and the organization’s ability to redirect released capacity or avoid future hiring.
Results. Platform scale, retained hybrid infrastructure, support demand, responsibility boundaries, and capacity reassignment can differ across organizations. To account for these risks, Forrester applied a 20% downward adjustment, yielding a three-year, risk-adjusted total PV (discounted at 10%) of $2.8 million.
7 FTEs
Annual platform operations and enablement capacity recaptured
Platform Engineering Efficiency
| Ref. | Metric | Source | Year 1 | Year 2 | Year 3 | |
|---|---|---|---|---|---|---|
| B1 | Prior state: Platform operations and enablement FTEs | Composite | 10.5 | 10.5 | 10.5 | |
| B2 | Expanded state: Platform operations and enablement FTEs | Composite | 3.5 | 3.5 | 3.5 | |
| B3 | Recaptured platform operations and enablement FTEs | B1-B2 | 7.0 | 7.0 | 7.0 | |
| B4 | Fully burdened hourly rate for a platform operations and enablement professional | Composite | $98 | $98 | $98 | |
| Bt | Platform engineering efficiency | B3*B4*2,080 | $1,426,880 | $1,426,880 | $1,426,880 | |
| Risk adjustment | ↓20% | |||||
| Btr | Platform engineering efficiency (risk-adjusted) | $1,141,504 | $1,141,504 | $1,141,504 | ||
| Three-year total: $3,424,512 | Three-year present value: $2,838,751 | |||||
Avoided Infrastructure And Platform Technology Costs
Evidence and data. Interviewees did not provide sufficiently comparable organization-specific nonlabor cost data to model this benefit directly. They described retiring infrastructure and consolidating portions of their platform technology footprint after moving eligible workloads to managed services, while retaining some on-premises and hybrid costs. Forrester used this qualitative evidence to develop rounded composite cost assumptions and phased realization rates.
Modeling and assumptions. Forrester models the following for the composite organization:
-
The composite incurs $500,000 in annual nonlabor platform costs in the prior state and $300,000 in the expanded state while supporting the same projected workload and use case demand. The $200,000 difference includes eligible compute, storage, networking, monitoring, backup and disaster recovery, non-Confluent software and support, and duplicate capacity. The values are intentionally rounded composite assumptions, not customer-reported budgets.
-
To reflect the phased retirement of prior-state costs, the composite realizes 75% of the eligible difference in Year 1, 90% in Year 2, and 100% in Year 3 as workloads move, contracts expire, and parallel run requirements end. The benefit excludes labor, Confluent fees, implementation, downtime losses, and any cost that continues in both states.
Risks. The scale of this benefit may vary from organization to organization based on:
-
The prior-state technology inventory and eligible nonlabor cost base.
-
The share of infrastructure retained for hybrid workloads.
-
The timing of contract, lease, and support renewals.
-
The expanded-state consumption profile.
-
The amount of duplicate capacity that can be retired while meeting the same demand.
Results. Because the eligible cost base, retained hybrid footprint, contract timing, and retirable duplicate capacity can vary materially, Forrester adjusted this benefit downward by 25%, yielding a three-year, risk-adjusted total PV (discounted at 10%) of $327,000.
$200,000
Annual eligible nonlabor platform cost difference before retirement timing and risk adjustment
Avoided Infrastructure And Platform Technology Costs
| Ref. | Metric | Source | Year 1 | Year 2 | Year 3 | |
|---|---|---|---|---|---|---|
| C1 | Prior state: Annual nonlabor platform cost | Composite | $500,000 | $500,000 | $500,000 | |
| C2 | Expanded state: Annual nonlabor platform cost | Composite | $300,000 | $300,000 | $300,000 | |
| C3 | Annual nonlabor platform cost difference | C1-C2 | $200,000 | $200,000 | $200,000 | |
| C4 | Share of cost difference retired or avoided | Composite | 75% | 90% | 100% | |
| Ct | Avoided infrastructure and platform technology costs | C3*C4 | $150,000 | $180,000 | $200,000 | |
| Risk adjustment | ↓25% | |||||
| Ctr | Avoided infrastructure and platform technology costs (risk-adjusted) | $112,500 | $135,000 | $150,000 | ||
| Three-year total: $397,500 | Three-year present value: $326,540 | |||||
Incident Response Efficiency
Evidence and data. Confluent Cloud provided a managed operating environment for eligible streaming workloads, reducing the infrastructure that customer teams had to administer directly. Following the migration and related platform changes, interviewees reported fewer high-severity incidents, shorter recovery times, fewer people involved in response, and lower on-call burden.
-
The senior director, data streaming platform, at a hospitality organization said streaming platform incidents fell from approximately 1 per month to 1 per quarter and estimated an 80% reduction in on-call work.
-
The senior fellow, software engineering and platforms, at a manufacturing organization reported no outages during the cited post-migration period.
-
The vice president of product at a retail technology organization reported that mean time to resolution improved from 8 or more hours to 1 to 4 hours and that typical incident involvement fell from six to 10 people to three to five.
-
The senior vice president, architecture, and senior lead analyst at a financial services organization described how, in some cases, 6-hour overnight troubleshooting calls became shorter diagnostic events.
Modeling and assumptions. Based on the ranges described in the interviews, Forrester models the following for the composite organization:
-
The composite experiences 12 high-severity production incidents per year in the prior state and four in the expanded state. Each prior-state incident requires eight responders working 8 active hours each; each expanded state incident requires four responders working 2.5 active hours each. Annual active response effort therefore falls from 768 hours to 40 hours, avoiding 728 hours per year.
-
In this analysis, “incident response engineer” refers to the technical employees directly involved in diagnosing and resolving high-severity incidents, regardless of their formal titles.
-
Forrester applies a fully burdened rate of $71 per hour of incident response engineer time and a 75% productivity recapture. The model leaves 25% of the avoided active response time unvalued because responders may not be able to redirect every saved hour to productive work. The benefit includes active triage, war-room coordination, troubleshooting, and recovery. It excludes routine support, planned maintenance, passive on-call availability, business downtime, lost revenue, service-level penalties, and customer experience effects.
Risks. The scale of this benefit may vary from organization to organization based on:
-
The organization’s incident history and definition of high severity.
-
The criticality and dependency footprint of the streaming environment.
-
The maturity of monitoring, observability, and diagnostic practices.
-
The number and role mix of incident responders.
-
The organization’s ability to redirect avoided response time to productive work.
Results. Differences in incident frequency, severity, responder mix, and active response time led Forrester to apply a 15% downward adjustment. The three-year, risk-adjusted total PV (discounted at 10%) is $82,000.
8
Fewer annual high-severity production incidents with Confluent
Incident Response Efficiency
| Ref. | Metric | Source | Year 1 | Year 2 | Year 3 | |
|---|---|---|---|---|---|---|
| D1 | Prior state: High-severity production incidents per year | Composite | 12.0 | 12.0 | 12.0 | |
| D2 | Prior state: Incident response engineers per incident | Composite | 8.0 | 8.0 | 8.0 | |
| D3 | Prior state: Response hours per incident response engineer | Composite | 8.0 | 8.0 | 8.0 | |
| D4 | Subtotal: Annual incident response hours (prior state) | D1*D2*D3 | 768.0 | 768.0 | 768.0 | |
| D5 | Expanded state: High-severity production incidents per year | Composite | 4.0 | 4.0 | 4.0 | |
| D6 | Expanded state: Incident response engineers per incident | Composite | 4.0 | 4.0 | 4.0 | |
| D7 | Expanded state: Response hours per incident response engineer | Composite | 2.5 | 2.5 | 2.5 | |
| D8 | Subtotal: Annual incident response hours (expanded state) | D5*D6*D7 | 40.0 | 40.0 | 40.0 | |
| D9 | Annual incident response hours avoided | D4-D8 | 728.0 | 728.0 | 728.0 | |
| D10 | Fully burdened hourly rate for an incident response engineer | Composite | $71 | $71 | $71 | |
| D11 | Productivity recapture rate | TEI methodology | 75% | 75% | 75% | |
| Dt | Incident response efficiency | D9*D10*D11 | $38,766 | $38,766 | $38,766 | |
| Risk adjustment | ↓15% | |||||
| Dtr | Incident response efficiency (risk-adjusted) | $32,951 | $32,951 | $32,951 | ||
| Three-year total: $98,853 | Three-year present value: $81,945 | |||||
Governance Standardization Efficiency
Evidence and data. Confluent supported more consistent message, schema, access, and review patterns as interviewees’ organizations expanded production streaming. Interviewees said that greater standardization reduced custom translation work and the governance, architecture, and coordination effort required for new or updated use cases.
-
The senior vice president, architecture, and senior lead analyst at a financial services organization said earlier projects defined messages differently and often required brokers or translation layers between formats. The organization later established enterprise messaging and governance standards to support its streaming architecture. The evidence indicated 10% to 25% less custom translation or broker work and 10 to 20 fewer governance, architecture, and coordination hours per use case after stronger standardization.
-
The senior fellow, software engineering and platforms, at a manufacturing organization described automated access provisioning, while other interviewees described more repeatable governance patterns. Standardization reduced governance and coordination effort but did not eliminate the underlying governance, security, architecture, or compliance work. Forrester therefore modeled only the review and coordination time avoided.
Modeling and assumptions. Based on the interviews, Forrester models the following for the composite organization:
-
The composite launches three new or materially updated production data streaming use cases in Year 1, five in Year 2, and seven in Year 3. Forrester applies an assumption of 15 hours of formal governance review and coordination avoided per use case. This is the total time saved across reviewers, not 15 hours per person.
-
The “data governance analyst” category covers architecture, security, access, review, and coordination work performed across roles, regardless of title.
-
Forrester applies a fully burdened rate of $98 per data governance analyst hour and a 75% productivity recapture rate. Forrester values 75% of the avoided governance and coordination time as productive capacity and leaves the remainder unquantified. The benefit excludes design, build, test, and deployment work; platform operations and enablement; incident response; custom translation labor; and broader trust, compliance, or business outcomes.
Risks. The scale of this benefit may vary from organization to organization based on:
-
The organization’s regulatory, security, privacy, and control requirements.
-
The maturity of message, schema, access, and review standards before the investment.
-
The number and role mix of reviewers.
-
The proportion of use cases requiring formal review.
-
The complexity of messages and data contracts.
-
The capabilities included in the deployment.
Results. Forrester reduced this benefit by 25% to account for variation in review requirements, use case mix, and reviewer participation. The three-year, risk-adjusted total PV (discounted at 10%) is $10,000.
15 hours
Governance review and coordination effort avoided per new or updated production data streaming use case
Governance Standardization Efficiency
| Ref. | Metric | Source | Year 1 | Year 2 | Year 3 | |
|---|---|---|---|---|---|---|
| E1 | Annual new or updated production data streaming use cases | Composite | 3 | 5 | 7 | |
| E2 | Governance review and coordination time avoided per use case (hours) | Composite | 15 | 15 | 15 | |
| E3 | Fully burdened hourly rate for a data governance analyst | Composite | $98 | $98 | $98 | |
| E4 | Productivity recapture rate | TEI methodology | 75% | 75% | 75% | |
| Et | Governance standardization efficiency | E1*E2*E3*E4 | $3,308 | $5,513 | $7,718 | |
| Risk adjustment | ↓25% | |||||
| Etr | Governance standardization efficiency (risk-adjusted) | $2,481 | $4,135 | $5,789 | ||
| Three-year total: $12,404 | Three-year present value: $10,022 | |||||
[CONTENT]
Unquantified Benefits
The financial analysis includes only selected labor and technology cost effects. Interviewees also described the following benefits, which are not quantified in this study:
-
Reusable streaming data and simpler data movement. The senior vice president, architecture, and senior lead analyst at a financial services organization described the same streams supporting more consumers, dashboards, and analytics while maintaining near-real-time performance and reported a 10% to 25% reduction in some custom message translation and broker work. The interviewees from the hospitality and financial services industries also described moving away from peer-to-peer and bespoke message patterns. The hospitality interviewee said the organization had not required an external professional services engagement during their two-year tenure. Because the interview did not establish the prior frequency, scope, or cost of such engagements, Forrester did not model avoided professional services spend separately. Forrester also identifies reusable data products, event streams, APIs, data services, secure sharing, and analytics as capabilities of modern data platforms, supporting the broader practice of governing data once and applying it across more consumers.4
-
Reduced manual work and faster technical onboarding. The senior fellow, software engineering and platforms at a manufacturing organization described approximately 10 people involved in identifying data problems and said the related activity declined by at least 75% after more repeatable streaming and error-handling patterns were established. The vice president of product at a retail technology organization reported that the time to a new engineer’s first successful publish-and-consume activity declined from approximately 1 to 2 months to 2 to 4 weeks, while the senior vice president, architecture, and senior lead analyst at a financial services organization described some familiarization falling from weeks to hours.
-
Faster operational and customer response. The senior director, data streaming platform at a hospitality organization reported that for approximately 200 hotels, loyalty points became available in about 15 minutes instead of an average of 2 days. The senior vice president, architecture, and senior lead analyst at a financial services organization described selected risk and fraud signals becoming available in less than an hour rather than the next day or later.
-
Greater trust and operational assurance. Interviewees described more consistent schemas and message patterns, automated access provisioning, improved traceability, lower on-call burden, and improved ability to keep production workflows available. The vice president of product at a retail technology organization also said incident response became less dependent on specific individuals.
Flexibility
The value of flexibility differs by customer. A customer may expand its use of Confluent and realize additional value through the following future options:
-
Expand governed production use cases and reusable streaming data products. The vice president of product at a retail technology organization expected streaming services to play a larger role as their organization’s insights platform expanded. The financial services and hospitality interviewees described broader reuse of standardized streams and fewer bespoke data paths. Organizations could extend governed streams to additional domains, applications, analytics, and customer-facing workflows while allowing more consumers to use common data products.
-
Extend real-time data across the broader data and analytics architecture. Interviewees described connecting streaming data with more applications, dashboards, analytical consumers, and operational workflows. Organizations could extend real-time data across more of their data and analytics architecture while maintaining lineage, access controls, observability, and data contracts.
-
Scale streaming capacity as demand changes. The senior director, data streaming platform at a hospitality organization described their difficulty forecasting traffic demand, and the vice president of product at a retail technology organization described the value of consumption-based scaling. Organizations could expand throughput or add workloads as demand changes without fixing all future capacity requirements at the start of the program.
-
Provide current operational context for future AI and automation use cases. The senior vice president, architecture, and senior lead analyst at a financial services organization described modern architecture and AI as increasing the need to move away from batch files, manual processes, and ETL-based data movement. The senior director, data streaming platform at a hospitality organization described a broader focus on data analytics, data science, and AI while noting that its AI work remained at an early stage. Organizations could use governed event streams to provide current operational context to future machine learning or agentic applications.
For this study, these future options are discussed qualitatively and remain outside the ROI and NPV calculations (described in more detail in Total Economic Impact Approach).
Analysis Of Costs
Quantified cost data as applied to the composite
Total Costs
| Ref. | Cost | Initial | Year 1 | Year 2 | Year 3 | Total | Present Value |
|---|---|---|---|---|---|---|---|
| Ftr | Incremental Confluent spend | $78,750 | $78,750 | $157,500 | $336,000 | $651,000 | $532,948 |
| Gtr | Non-Confluent implementation and migration costs | $977,109 | $0 | $0 | $0 | $977,109 | $977,109 |
| Total costs (risk-adjusted) | $1,055,859 | $78,750 | $157,500 | $336,000 | $1,628,109 | $1,510,057 |
Incremental Confluent Spend
Evidence and data. Confluent provided the product and services scope and timing used to model incremental Confluent spend. This included $150,000 in one-time Confluent professional services, as well as staged recurring expansion of $150,000 in Year 2 and $320,000 in Year 3 above the continuing annual baseline. Actual Confluent spend can vary with workload and consumption, product and support scope, contract terms, and timing. Contact Confluent for more information.
Modeling and assumptions. Based on pricing and scope information provided by Confluent, Forrester models the following for the composite organization:
-
The prior state and expanded state both include $1.0 million of annual Confluent spend in Year 1. The prior state remains at $1.0 million in Years 2 and 3. The expanded state increases to $1.15 million in Year 2 and $1.32 million in Year 3. The incremental recurring spend is therefore $0 in Year 1, $150,000 in Year 2, and $320,000 in Year 3. The Year 3 amount is the total difference from the $1.0 million baseline; it is not added to the Year 2 amount.
-
Across the three years, the expanded state includes $3.47 million in total recurring Confluent spend versus $3.0 million in the prior state. The $470,000 difference is the recurring cost included in the TEI model. The $3.0 million common baseline is excluded because it occurs in both states. The composite also incurs $150,000 in one-time Confluent professional services, split evenly between the Initial period and Year 1.
Only Incremental Confluent Spend Is Included In The Financial Analysis
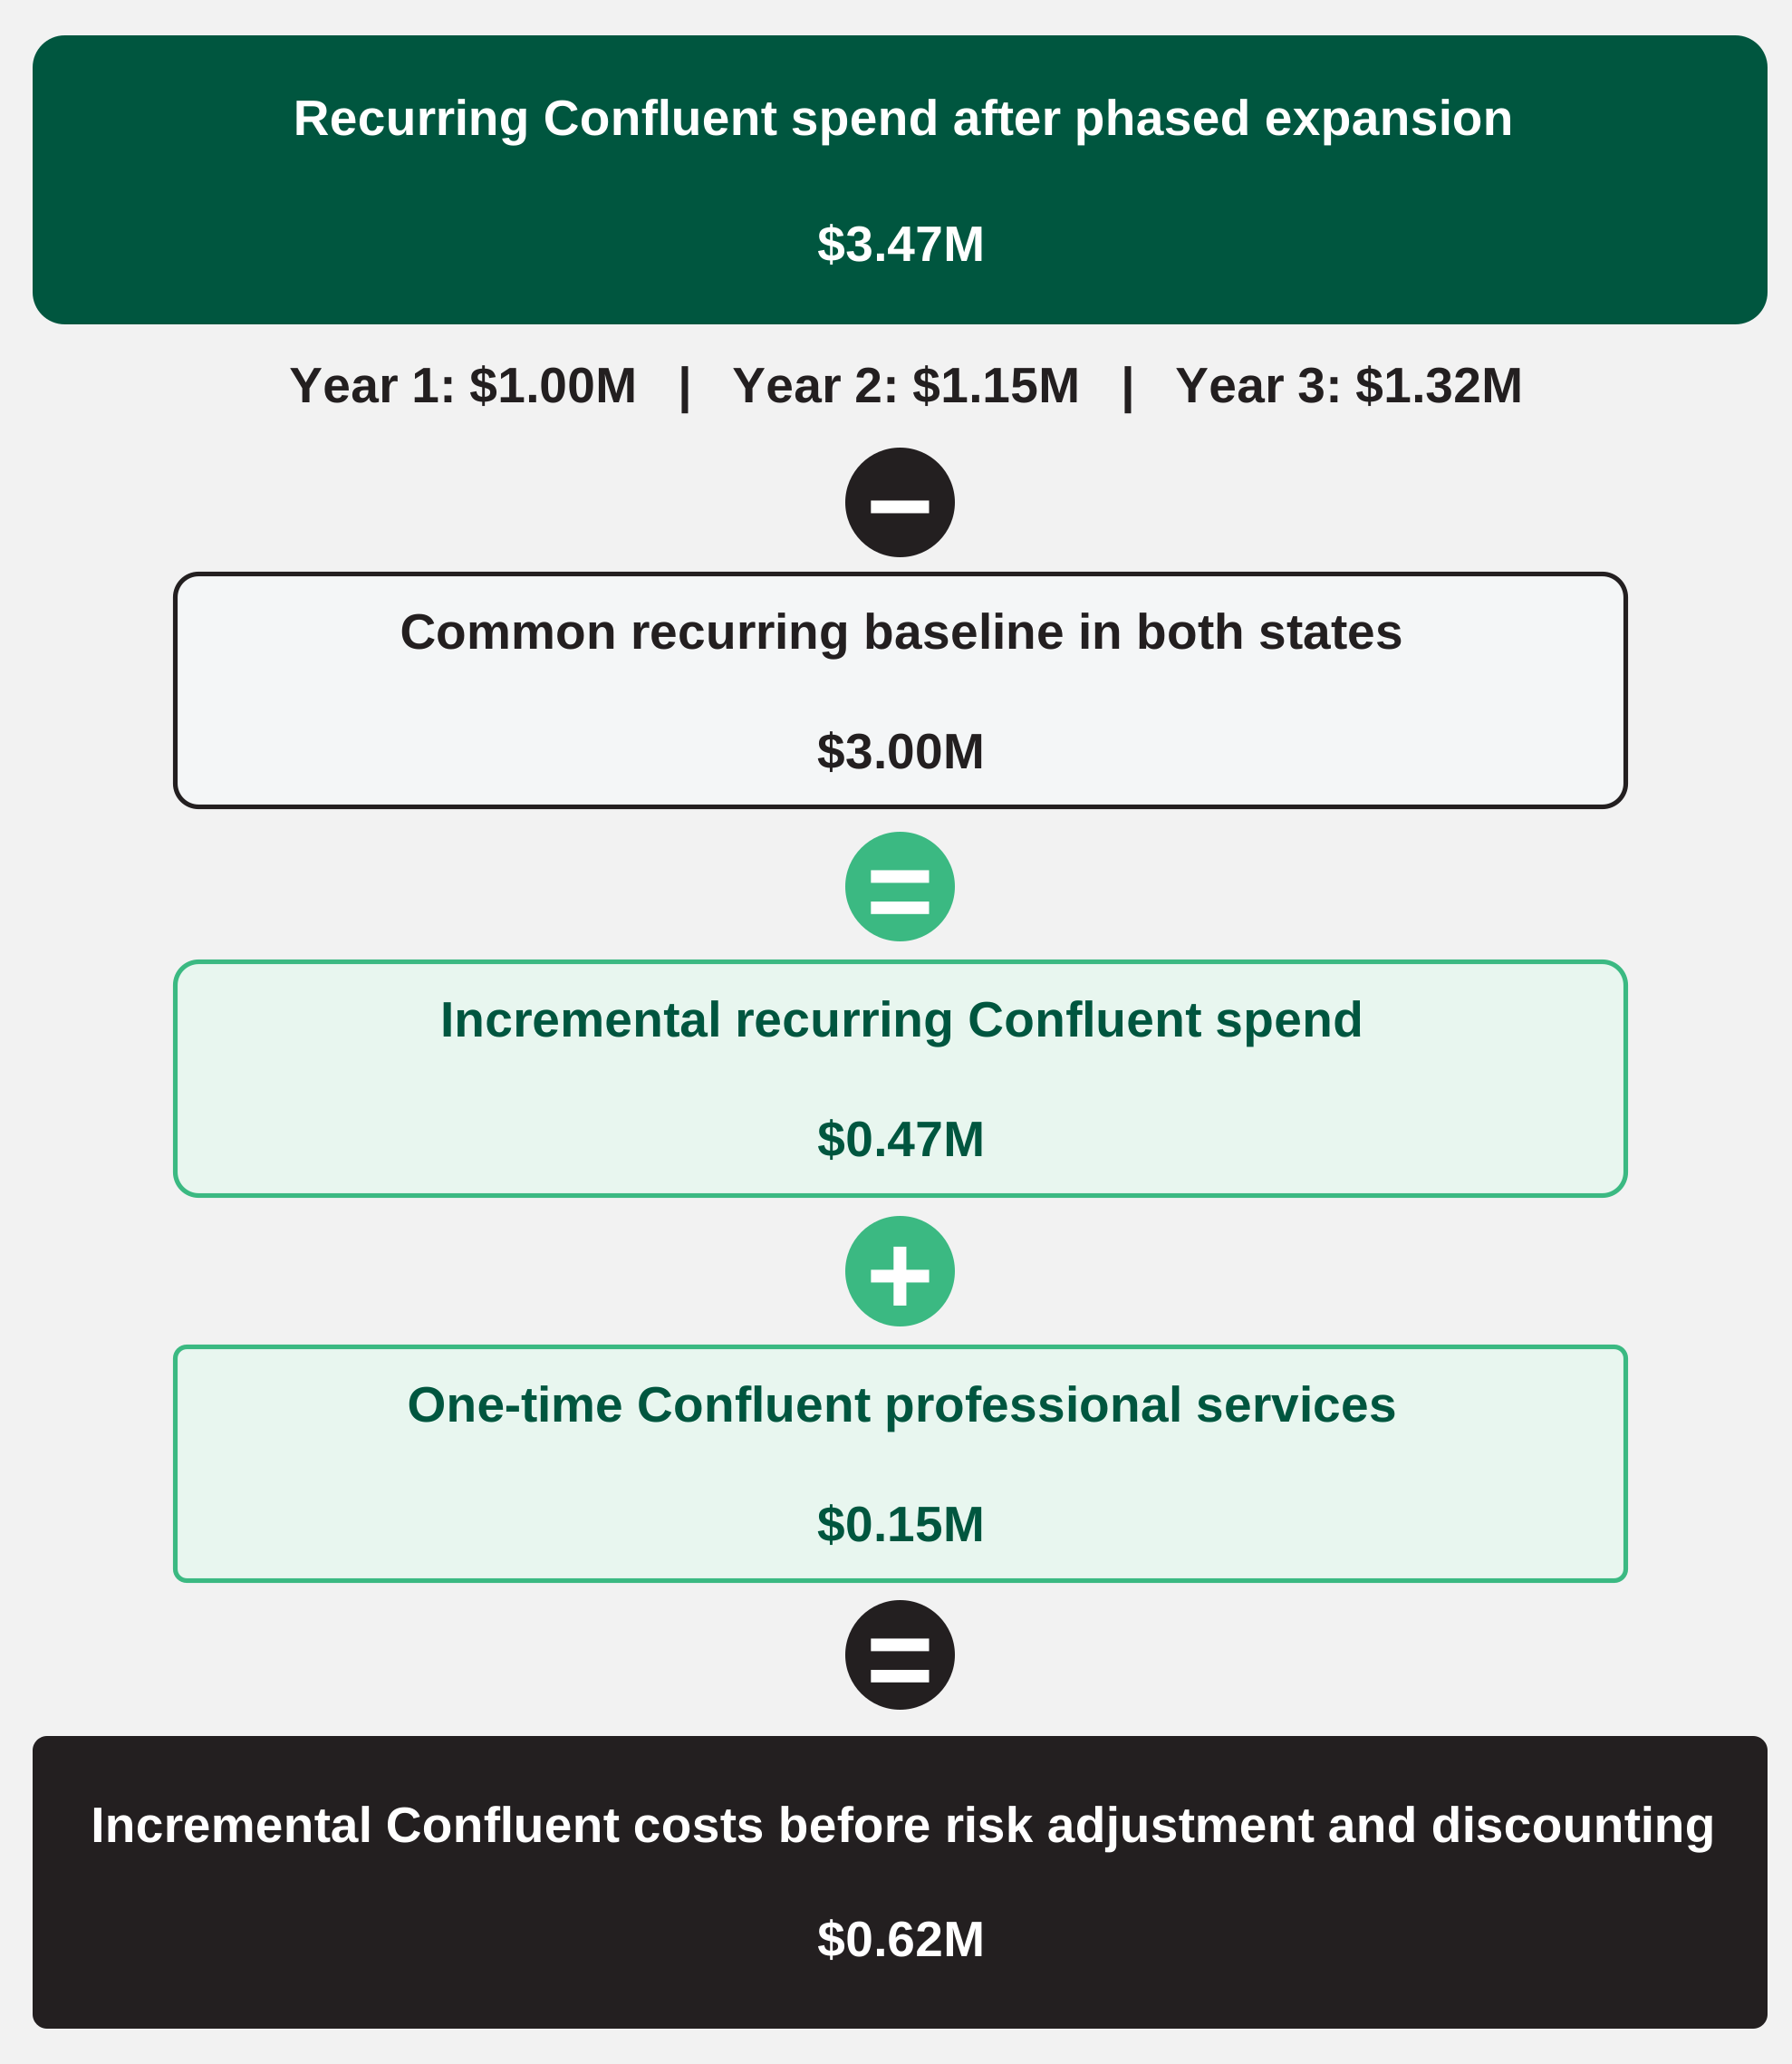
Both the prior and expanded states include the same $1.0 million annual baseline, which is excluded from incremental Confluent spend.
Source: Forrester Consulting
Risks. The impact of this cost may vary by organization depending on the following:
-
The workload and consumption profile.
-
The product and support scope.
-
The contract terms and discounts.
-
The timing of expansion.
-
The amount and timing of Confluent professional services.
Results. Given variability in consumption, contract terms, support scope, expansion timing, and professional services, Forrester adjusted this cost upward by 5%, yielding a three-year, risk-adjusted total PV (discounted at 10%) of $533,000.
Incremental Confluent Spend
| Ref. | Metric | Source | Initial | Year 1 | Year 2 | Year 3 |
|---|---|---|---|---|---|---|
| F1 | Incremental recurring Confluent spend | Composite | $0 | $0 | $150,000 | $320,000 |
| F2 | One-time Confluent professional services cost | Composite | $75,000 | $75,000 | $0 | $0 |
| Ft | Incremental Confluent spend | F1+F2 | $75,000 | $75,000 | $150,000 | $320,000 |
| Risk adjustment | ↑5% | |||||
| Ftr | Incremental Confluent spend (risk-adjusted) | $78,750 | $78,750 | $157,500 | $336,000 | |
| Three-year total: $651,000 | Three-year present value: $532,948 | |||||
Non-Confluent Implementation And Migration Costs
Evidence and data. Migrating and expanding production streaming on Confluent required non-Confluent partner services and customer labor across architecture, networking, security, platform engineering, migration, testing, and production readiness. Interviewees described teams and timelines that varied with the starting environment and rollout scope.
-
The senior director, data streaming platform at a hospitality organization reported a peak rollout team of approximately 20 people and more than $250,000 in one-time setup costs, including private networking and connector-hosting environments.
-
The vice president of product at a retail technology organization described seven to 10 people working for approximately 3 months, while the senior fellow, software engineering and platforms at a manufacturing organization described a longer study, design, and execution period with a smaller core team and added support as needed.
-
Confluent provided an approximately $1.0 million planning estimate for non-Confluent implementation and migration costs. Forrester assessed the modeled scope against interview evidence on implementation activities, staffing, and duration.
Modeling and assumptions. Based on Confluent’s cost input and the interview evidence described above, Forrester models the following for the composite organization:
-
The composite incurs one-time non-Confluent services and internal labor costs for the migration, modernization, and expansion. These costs include $637,500 for systems integrator or implementation partner services and $212,160 in internal labor, equivalent to two FTEs working for 6 months at a fully burdened rate of $102 per hour. The resulting non-Confluent total is $849,660 before risk adjustment.
-
After the 15% upward adjustment, the modeled cost is $977,109.
Risks. The impact of this cost may vary by organization depending on the following:
-
The number of clusters, pipelines, connectors, and data paths to move.
-
The organization’s cloud, networking, security, and regulatory requirements.
-
The availability and allocation of internal resources.
-
The implementation partner scope and rates.
-
The implementation duration.
Results. To account for differences in implementation scope, duration, partner rates, and internal resource requirements, Forrester increased this cost by 15%. This yields a three-year, risk-adjusted total PV (discounted at 10%) of $977,000.
$849,660
Non-Confluent implementation and migration cost before risk adjustment
Non-Confluent Implementation And Migration Costs
| Ref. | Metric | Source | Initial | Year 1 | Year 2 | Year 3 |
|---|---|---|---|---|---|---|
| G1 | Systems integrator or implementation partner services cost | Composite | $637,500 | |||
| G2 | Average internal implementation and migration FTEs | Composite | 2 | |||
| G3 | Implementation and migration duration (months) | Composite | 6 | |||
| G4 | Fully burdened hourly rate for an internal implementation and migration resource | Composite | $102 | |||
| G5 | Subtotal: Internal implementation and migration labor cost | G2*(G3/12)*2,080*G4 | $212,160 | |||
| Gt | Non-Confluent implementation and migration costs | G1+G5 | $849,660 | |||
| Risk adjustment | ↑15% | |||||
| Gtr | Non-Confluent implementation and migration costs (risk-adjusted) | $977,109 | $0 | $0 | $0 | |
| Three-year total: $977,109 | Three-year present value: $977,109 | |||||
Financial Summary
Consolidated Three-Year, Risk-Adjusted Metrics
Cash Flow Chart (Risk-Adjusted)
Cash Flow Analysis (Risk-Adjusted)
| Initial | Year 1 | Year 2 | Year 3 | Total | Present Value | |
|---|---|---|---|---|---|---|
| Total costs | ($1,055,859) | ($78,750) | ($157,500) | ($336,000) | ($1,628,109) | ($1,510,057) |
| Total benefits | $0 | $1,370,355 | $1,448,455 | $1,519,055 | $4,337,865 | $3,584,136 |
| Net benefits | ($1,055,859) | $1,291,605 | $1,290,955 | $1,183,055 | $2,709,756 | $2,074,079 |
| ROI | 137% | |||||
| Payback | 10 months |
Please Note
The financial results calculated in the Benefits and Costs sections can be used to determine the ROI, NPV, and payback period for the composite organization’s investment. Forrester assumes a yearly discount rate of 10% for this analysis.
These risk-adjusted ROI, NPV, and payback period values are determined by applying risk-adjustment factors to the unadjusted results in each Benefit and Cost section.
The initial investment column contains costs incurred at “time 0” or at the beginning of Year 1 that are not discounted. All other cash flows are discounted using the discount rate at the end of the year. PV calculations are calculated for each total cost and benefit estimate. NPV calculations in the summary tables are the sum of the initial investment and the discounted cash flows in each year. Sums and present value calculations of the Total Benefits, Total Costs, and Cash Flow tables may not exactly add up, as some rounding may occur.
From the information provided in the interviews, Forrester constructed a Total Economic Impact™ framework for those organizations considering an investment in Confluent.
The objective of the framework is to identify the cost, benefit, flexibility, and risk factors that affect the investment decision. Forrester took a multistep approach to evaluate the impact that Confluent can have on an organization.
Due Diligence
Interviewed Confluent stakeholders and Forrester analysts to gather data relative to Confluent.
Interviews
Interviewed four decision-makers at organizations using Confluent to obtain data about costs, benefits, and risks.
Composite Organization
Designed a composite organization based on characteristics of the interviewees’ organizations.
Financial Model Framework
Constructed a financial model representative of the interviews using the TEI methodology and risk-adjusted the financial model based on issues and concerns of the interviewees.
Case Study
Employed four fundamental elements of TEI in modeling the investment impact: benefits, costs, flexibility, and risks. Given the increasing sophistication of ROI analyses related to IT investments, Forrester’s TEI methodology provides a complete picture of the total economic impact of purchase decisions. Please see Appendix A for additional information on the TEI methodology.
Total Economic Impact Approach
Benefits
Benefits represent the value the solution delivers to the business. The TEI methodology places equal weight on the measure of benefits and costs, allowing for a full examination of the solution’s effect on the entire organization.
Costs
Costs comprise all expenses necessary to deliver the proposed value, or benefits, of the solution. The methodology captures implementation and ongoing costs associated with the solution.
Flexibility
Flexibility represents the strategic value that can be obtained for some future additional investment building on top of the initial investment already made. The ability to capture that benefit has a PV that can be estimated.
Risks
Risks measure the uncertainty of benefit and cost estimates given: 1) the likelihood that estimates will meet original projections and 2) the likelihood that estimates will be tracked over time. TEI risk factors are based on “triangular distribution.”
Financial Terminology
Present value (PV)
The present or current value of (discounted) cost and benefit estimates given at an interest rate (the discount rate). The PVs of costs and benefits feed into the total NPV of cash flows.
Net present value (NPV)
The present or current value of (discounted) future net cash flows given an interest rate (the discount rate). A positive project NPV normally indicates that the investment should be made unless other projects have higher NPVs.
Return on investment (ROI)
A project’s expected return in percentage terms. ROI is calculated by dividing net benefits (benefits less costs) by costs.
Discount rate
The interest rate used in cash flow analysis to take into account the time value of money. Organizations typically use discount rates between 8% and 16%.
Payback
The breakeven point for an investment. This is the point in time at which net benefits (benefits minus costs) equal initial investment or cost.
Appendix A
Total Economic Impact
Total Economic Impact is a methodology developed by Forrester Research that enhances a company’s technology decision-making processes and assists solution providers in communicating their value proposition to clients. The TEI methodology helps companies demonstrate, justify, and realize the tangible value of business and technology initiatives to both senior management and other key stakeholders.
Appendix B
Supplemental Material
The Streaming Data Platforms Landscape, Q3 2025, Forrester Research, Inc., July 1, 2025
Key Capabilities Of A Modern Data And AI Platform, Forrester Research, Inc., November 4, 2025
The Forrester Data, AI, And Analytics Architecture Model, Forrester Research, Inc., October 6, 2025
The Future Of Data Platforms, Forrester Research, Inc., October 10, 2025
Batch Be Gone: How AAFES Improved Operations With Event-Driven Architecture, Forrester Research, Inc., May 10, 2024
Mike Gualtieri, AI Agents Need Real-Time Context: Data Streaming Is How You Are Going To Get It, Forrester Blogs
Appendix C
Endnotes
1 Source: Mike Gualtieri, AI Agents Need Real-Time Context: Data Streaming Is How You Are Going To Get It, Forrester Blogs.
2 Source: The Streaming Data Platforms Landscape, Q3 2025, Forrester Research, Inc., July 1, 2025.
3 Total Economic Impact is a methodology developed by Forrester Research that enhances a company’s technology decision-making processes and assists solution providers in communicating their value proposition to clients. The TEI methodology helps companies demonstrate, justify, and realize the tangible value of business and technology initiatives to both senior management and other key stakeholders.
4 Source: Key Capabilities Of A Modern Data And AI Platform, Forrester Research, Inc., November 4, 2025.
Disclosures
Readers should be aware of the following:
This study is commissioned by Confluent, an IBM company, and delivered by Forrester Consulting. It is not meant to be used as a competitive analysis.
Forrester makes no assumptions as to the potential ROI that other organizations will receive. Forrester strongly advises that readers use their own estimates within the framework provided in the study to determine the appropriateness of an investment in Confluent. For any interactive functionality, the intent is for the questions to solicit inputs specific to a prospect’s business. Forrester believes that this analysis is representative of what companies may achieve with Confluent based on the inputs provided and any assumptions made. Forrester does not endorse Confluent or its offerings. Although great care has been taken to ensure the accuracy and completeness of this model, Confluent and Forrester Research are unable to accept any legal responsibility for any actions taken on the basis of the information contained herein. The interactive tool is provided ‘AS IS,’ and Forrester and Confluent make no warranties of any kind.
IBM and Confluent reviewed and provided feedback to Forrester, but Forrester maintains editorial control over the study and its findings and does not accept changes to the study that contradict Forrester’s findings or obscure the meaning of the study.
Confluent, an IBM company, provided the customer names for the interviews but did not participate in the interviews.
Consulting Team:
Albert Demery
Published
September 2026
 PDF
PDF /3%20-%20Case%20Study/Case%20Study/CFLT_Figure_1_Migration_Modernization_Expansion.svg?d=w5eb507eb7bc043278589f82165b21a57&csf=1&web=1&e=IWQ5uh)