The Value Of Building An Economic Business Case With Forrester

Cost Savings And Business Benefits Enabled By A Forrester Total Economic Impact™ Study

A Forrester Total Economic Impact™ Study Commissioned By Forrester, July 2022

60%

increase in leads in the first six months

59% of purchasing decision-makers say that the marketing materials they receive from vendors are useless to them.1 Given this, solution providers need to explain precisely how their solutions impact customers. Forrester’s TEI study provides an objective analysis of the benefits — including the economic benefits — costs, risks, and flexibility that buyers realize using an organization’s solution. Solution providers leveraging TEI realize an increase in revenue while improving the efficiency of their sales and marketing teams.

Change in conversion rate

1% → 2.5%

According to Forrester Research, 65% of global decision-makers don’t trust the content they receive from vendors.2 Too often, content is biased toward the provider’s solution rather than the buyer’s priorities and concerns.

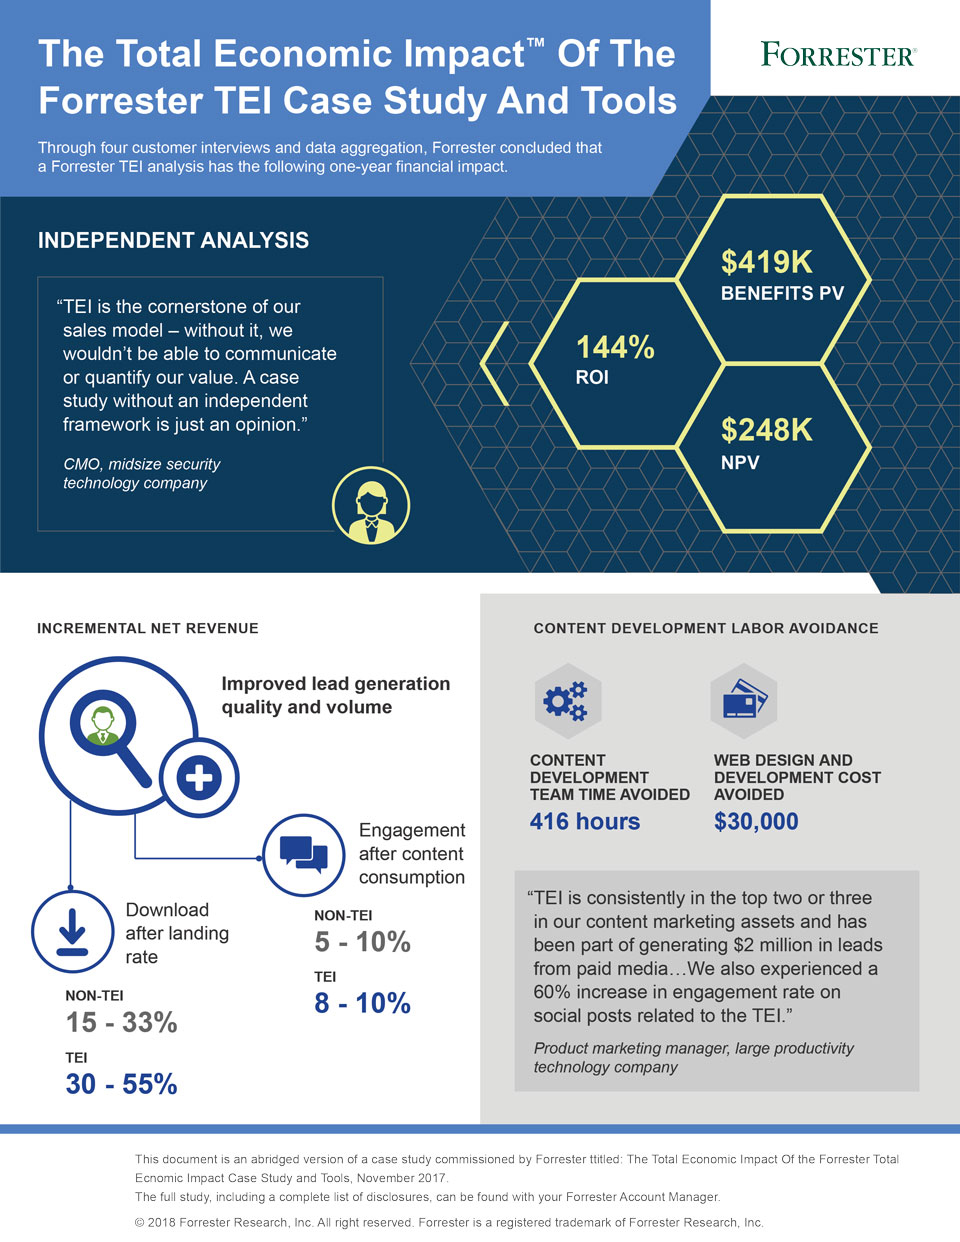
Total Economic Impact™ (TEI) is Forrester’s proven methodology to justify, quantify, and articulate the value of an investment. This independent and objective analysis provides companies with the ability to align their product, sales, and marketing teams with quantitative and qualitative data straight from the voice of their customers.3

Times saved for sales building business content

33%

Forrester Consulting conducted a Total Economic Impact (TEI) study and examined the potential return on investment (ROI) enterprises may realize from a Forrester TEI study. To better understand the benefits, costs, risks, and long-term flexibility associated with a Forrester TEI study investment, Forrester interviewed eight recent customers. For the purposes of this study, Forrester aggregated the experiences of the interviewed customers and combined the results into a single composite organization.

Prior to creating a TEI case study with Forrester, solution providers struggled to create content to address the diverse needs and priorities of disparate decision-makers involved in a purchase decision. As a result, sales cycles were longer than desired, especially when unexpected decision-makers and influencers joined the buying conversations. Sales leaders complained to marketing that existing case studies focused on experiences rather than tangible business outcomes. Sales reps asked for ROI analyses that could be customized to a buyer’s organization.

Time saved roadmapping a marketing asset

20%

Moreover, because companies themselves created the content, potential buyers were skeptical of the results. These limitations led to frustration from marketers: Even though they had proof of their products’ abilities to solve prospects’ problems, customers remained unconvinced. As a result, they were often unable to show the impact of marketing efforts on the company’s bottom line.

Time saved creating a marketing asset

95%

With the TEI study, the interviewees were able to generate higher volume and better-quality leads than previously experienced, resulting in additional profit. Both sales and marketing teams were more productive with a marketing asset that could drive substantial business gains to attract new prospects and retain current customers.

Project Director: Reggie Lau, Principal Consultant


Key Statistics

  • icon

    ROI

    134%
  • icon

    Benefits PV

    $368K
  • icon

    NPV

    $211K
  • icon

    Payback

    < 6 months

“The TEI study influenced 233 active opportunities, which is equivalent to $19 million, since it was published five months ago. Of those 233, 54 have closed won.”

Director of product marketing, SaaS

Key Findings

Quantified benefits. Risk-adjusted present value (PV) quantified benefits for the composite organization include:

  • Increased leads by 60% and increased conversion rate from 1% to 2.5%, resulting in a boost to new profit. After publishing the TEI study, the composite organization sees improved quality and volume of marketing qualified leads (MQLs), which leads to an increase in sales qualified leads (SQLs) and conversions. Sales teams also successfully use the TEI in renewal conversations, helping to retain clients by giving them tangible data to share with their decision-makers. Moreover, the TEI study helps sales teams handle objections in buying conversations and reduces average sales cycle time.

  • Reduced time developing a business case by 33%. At the composite organization, many salespeople struggled to have clear and credible messaging that quickly helped build pipeline. With a detailed ROI analysis from Forrester’s TEI study, salespeople are more easily able to build custom business cases for customers. Moreover, backed by an objective analysis from Forrester, salespeople are able to have richer conversations with their decision-makers, both initially and during renewals.

  • Reduced time to create content marketing by 95%. Because the Forrester Consulting team creates the study, the composite organization avoids dedicating its internal resources to try to develop a similar content piece. At the composite organization, this saves 500 hours for content marketers who don’t have to scope, write, and edit the piece, as well as 80 hours from the various executives across the revenue engine.

  • Generated additional incremental profit from new leads with the TEI calculator. Some interviewees reported an increase in marketing’s contribution to sales because of an investment in the TEI calculator. (The TEI calculator is a derivative of the TEI study and is available at an additional cost.) Because not all interviewees purchased a TEI calculator, Forrester excluded this benefit in the financial model and ROI calculation. However, a simple calculation is provided in Table D.

Unquantified benefits. Benefits that are not quantified for this study include:

  • Engaged decision-makers who were otherwise uncertain or reluctant with purchase support. During the buying process, there are various personas across disparate departments who have different priorities and authority throughout the buyer’s journey.4 The TEI study was able to engage many stakeholders, thereby providing the justification needed for stalled deals.

  • Elevated brand awareness across the customer lifecycle. Interviewees said the TEI study was a piece of content that they were able to utilize with various audiences — from prospects to existing customers to media influencers. Having a Forrester TEI study improved the brand awareness of interviewees’ organizations and gave them greater reach across the customer landscape.

  • Created consistency and alignment around providers’ or sellers’ value propositions. By participating in the TEI process, interviewees said they were able to sharpen messaging, brand positioning, and strategy as the voice-of- the-customer data provided insights into which product benefits mattered most to customers. The reverse was also true: Interviewees shared that they were able to deprioritize certain benefits on landing pages and in marketing collateral that customers didn’t fully recognize.

  • Supplied primary research and voice-of-the- customer data and feedback. Interviewees said that having insight into actual customer data and feedback in the study was a key benefit of working with Forrester. Many of the interviewees reused that data, such as including quotes from the study into key marketing campaigns, sales reference materials, and press releases.

Costs. Risk-adjusted PV costs for the composite organization include:

  • Forrester TEI and infographic fees. These comprise the content development cost for a Forrester TEI multicompany case study (MCCS) as well as an infographic summary of the results. Readers should keep in mind that TEI costs can vary based upon content needs, scope, and additional derivatives.

  • Internal labor costs. This cost includes the internal time and effort the composite organization needs to participate in stakeholder interviews, gather collateral, vet and introduce customers to the Forrester team, provide feedback on the study, and generally manage the TEI project and interact with Forrester during the 14- to 16-week process.

The customer interviews and financial analysis found that a composite organization experiences benefits of $368,000 over 18 months versus costs of $157,000, adding up to a net present value (NPV) of $211,000 and an ROI of 134%.

“The only two big pieces of gated content we had last year for corporate, my team wrote them, so they definitely didn’t carry the Forrester weight. Those two pieces of content last year came up to about 60% or 70% of what we achieved with Forrester.”

Global director of product marketing, legal technology

Benefits (18 Months)

Incremental profit from generating new leads Business case development time savings Content marketing creation time savings

“The TEI is the gold standard. It comes from Forrester and provides an ROI and justification for our software.”

VP of marketing, cybersecurity SaaS

TEI Framework And Methodology

From the information provided in the interviews, Forrester constructed a Total Economic Impact™ framework for those organizations considering an investment in a Forrester TEI study.

The objective of the framework is to identify the cost, benefit, flexibility, and risk factors that affect the investment decision. Forrester took a multistep approach to evaluate the impact that the TEI study can have on an organization.

  1. DUE DILIGENCE

    Interviewed Forrester stakeholders and Forrester analysts to gather data relative to the TEI study.

  2. CUSTOMER INTERVIEWS

    Interviewed eight decision-makers at organizations using the TEI study to obtain data with respect to costs, benefits, and risks.

  3. COMPOSITE ORGANIZATION

    Designed a composite organization based on characteristics of the interviewed organizations.

  4. FINANCIAL MODEL FRAMEWORK

    Constructed a financial model representative of the interviews using the TEI methodology and risk-adjusted the financial model based on issues and concerns of the interviewed organizations.

  5. CASE STUDY

    Employed four fundamental elements of TEI in modeling the investment impact: benefits, costs, flexibility, and risks. Given the increasing sophistication of ROI analyses related to IT investments, Forrester’s TEI methodology provides a complete picture of the total economic impact of purchase decisions. Please see Appendix A for additional information on the TEI methodology.

DISCLOSURES

Readers should be aware of the following:

This study is commissioned by Forrester and delivered by Forrester Consulting. It is not meant to be used as a competitive analysis.

Forrester makes no assumptions as to the potential ROI that other organizations will receive. Forrester strongly advises that readers use their own estimates within the framework provided in the study to determine the appropriateness of an investment in the TEI study.

Forrester reviews and provides feedback to clients who undertake TEI studies, but Forrester maintains editorial control over the study and its findings and does not accept changes to the study that contradict Forrester’s findings or obscure the meaning of the study.

Forrester provided the customer names for the interviews but did not participate in the interviews.

Interviews

Role Industry Headquarters Revenue
VP of marketing Cybersecurity SaaS United States $300 million
Director of product marketing SaaS United States $120 million
Director of product marketing Telecommunications services United States $60 million
Global director of product marketing Legal technology United States $110 million
Senior director of research and innovation Software development United States $40 million
Solution marketing leader for value Service cloud United States $5 billion
Marketing and research strategist Operations management software Australia $85 million
Director of product marketing Cybersecurity United States $4.3 billion

“Because [our solution] is a big price point, we often get asked by customers, ‘Is there anything you can share with me that I can share up the ladder that shows why we should make this investment?’”

Director of product marketing, telecommunications services

Key Challenges

Like many marketing departments, the interviewees struggled to not only create content that spoke to all buyers but also to prove marketing’s contributions to company sales.

Executives wanted a solution that could overcome sales objections and clearly articulate the benefits of their products to address challenges, including:

  • Lack of negotiating leverage for sales teams. As with many companies, the interviewees’ sales teams needed to get past obstacles within the sales cycle. A VP of marketing at a cybersecurity SaaS company explained: “Reps were getting stuck at that pricing objection and said they needed more ammunition to help get over that hurdle. Customers see the value of the product and like the features. They want to buy it. But they can’t justify it.”

  • Need for unbiased, independent content around offerings. Interviewees shined a light on their best customer experiences and stories. However, prospects remained skeptical because this content was created in-house, and it was obvious that companies would only share positive experiences. Decision-makers wanted content that could bring credibility to their claims and would be trusted by their audience.

  • Inability to create an easy-to-use business case. Prior to engaging with Forrester, interviewees struggled to give salespeople self-service tools for creating custom business value presentations. Sales teams often leaned on different marketing individuals for support and, consequently, different (and unvetted) versions of proposal materials floated around the sales organization. A director of product marketing at a cybersecurity firm told Forrester: “Business cases can be something that are hotly debated as you talk to a global sales force and different product leaders. We had a lot of debate on what metrics really matter and what not to include.” Having the TEI in place helped interviewees consolidate the different approaches into one powerful one.

  • Lack of a value proposition that spoke to both the hard and soft benefits. Interviewees said that while clarifying the different ways in which their products add value is important, it’s hard for their companies to be organized about those different value propositions, especially when different stakeholders have their own priorities. A global director of product marketing at a legal technology company said, “A key objective was to quantify and prove tangible business outcomes as opposed to merely end-user experience features.”

Investment Object

The interviewees’ organizations highlighted some of the criteria they used when deciding to invest in a TEI study. Here is what they told Forrester.

  • The director of product marketing for a cybersecurity SaaS firm said: “We’re using the TEI study specifically for upmarket as our company is really good downmarket. We have strong penetration around small and medium businesses; however, for enterprise and strategic accounts, we were a little bit slower to get that adoption. The goal of purchasing a TEI study was to help bigger deals across the finish line.”
  • The senior director of research and innovation at a software development company shared: “We were looking for external validation of the estimated business value of our product. We had internally generated some estimates and calculations of the financial impact that it would probably have on our customers,but we needed external validation to further ease the sales lifecycle.”
  • The director of product marketing at a cybersecurity organization noted:“Our decision to invest in a TEI was both for brand reputation but also product differentiation. The TEI has allowed us to constantly differentiate our product in the market.”

Composite Organization

Based on the interviews, Forrester constructed a TEI framework, a composite company, and an ROI analysis that illustrates the areas financially affected. The composite organization is representative of those of the eight decision-makers Forrester interviewed and is used to present the aggregate financial analysis in the next section. The composite organization has the following characteristics:

Description of composite. The composite organization is a global business-to-business technology company. It has a strong brand, global operations, and $500 million in annual revenue. The composite organization has 1,000 employees, including 200 in sales. Each year they deploy four central marketing campaigns (one per quarter) around their unified vision and strategy, gaining 200 leads for each of those campaigns. While the composite organization’s marketing team is mature and develops content for a variety of channels, their content is unable to speak to all members of the buying group and does not generate as many qualified leads as needed for growth.

Deployment characteristics. While the composite organization has a larger marketing team, it dedicates three marketers to the TEI project who act as the project managers and have weekly check-ins with the Forrester Consulting team. They will provide Forrester with marketing and sales collateral, introduce leadership and stakeholders, provide feedback on the customer interview guide, source the customers for customer interviews, discuss the findings, and offer feedback on the final study. Their ability to support the consulting team’s needs will help the project stay on the proposed timeline. After receiving the final study, these marketers will create additional marketing materials (blogs, email campaigns, social media tiles, etc.) to help activate the study across the industry and market.

Key assumptions:
  • $500 million in revenue
  • 1,000 employees, 200 in sales
  • 4 campaigns per year
  • 200 leads per campaign
  • 3 marketers dedicated to the TEI project and its go-to-market collateral and assets

Total Benefits

Ref. Benefit 6 Months 12 Months 18 Months Total Present Value
Atr Incremental profit from generating new leads $84,375 $70,313 $56,250 $210,938 $177,076
Btr Business case development time savings $57,708 $57,708 $43,719 $159,136 $133,002
Ctr Content marketing creation time savings $63,650 $0 $0 $63,650 $57,864
Dtr Incremental profit from generating Dtr new leads with the TEI calculator (see Table D) x x x x x
Total benefits (risk-adjusted) $205,734 $128,021 $99,969 $433,723 $367,942

Incremental Profit From Generation New Leads

Evidence and data. Decision-makers interviewed for this study shared that their organizations saw an increase in the number and quality of leads, which led to an increase in incremental profit. This was one of the interviewees’ main objectives in purchasing the TEI study; the analysis provided the insight needed into both the quantitative and qualitative benefits of their solutions.

Because Forrester is an objective, third-party organization, the interviewees indicated that both prospects and customers were more inclined to believe the results and therefore more inclined to buy. All eight interviewees said that they were able to gain the credibility that they previously sought. A director of product marketing for a SaaS company told Forrester, “It certainly gives us credibility, and it’s a great resource to reference as prospects are considering what the short- and long-term ROI from our solution will be.”

The interviewees used their studies’ findings in a variety of ways to engage prospective buyers. Several reported conducting a public-facing webinar, creating landing pages, and using other bite-sized assets that discussed the TEI study to generate even more leads.

A global director of product marketing for a legal technology firm shared these results: “We had 113 people attend the webinar; we had 369 form fills from the main page of our website; we had 815 form fills from advertising and content syndication; we had over 70 open opportunities where it contributed to a multitouch campaign; and we had about 16 opportunities where it was actually our first touch. And of those first-touch opportunities, two of them are currently closed, one with a value of over $400,000.”

Interviewees shared that in addition to an uptick in new leads thanks to the TEI study, they also had stronger renewal conversations with their current customers. A marketing and research strategist at an operations management software company shared this story with Forrester: “Our sales team has had a lot of success in using the TEI in expansion conversations. When it's time for clients to renew, they will be able to point to this and be like, ‘These are some of the benefits that our other customers have seen or potential customers will see if you continue to use the product.’ It has been very beneficial in getting the deals across the line or being able to enrich the conversations that they have upon renewal or upon extension to drive more revenue.”

Many interviewees compared their internal assets’ performance against that of the TEI study and found that the TEI drove more leads and conversions. A director of product marketing for a telecommunications services company shared these results: “Since the TEI has gone live, we’ve been able to generate over 3,785 leads from the report itself. It is one of the best-performing assets that we have in our portfolio. Our number two white paper asset has only 1,500 to 1,600 leads. The TEI is double that.”

Modeling and assumptions. For the composite organization, Forrester assumes:

  • The average number of leads per campaign for a non-TEI asset is 625.
  • The organization experiences a 60% increase in leads from the TEI study in the first six months. As the data becomes older and the study is in the market for some time, the percentage increase of leads flattens over time to an increase of 40% after 12 months and an increase of 20% after 18 months.
  • The average conversion rate for the composite is 1%; however, campaigns based on the Forrester TEI study yield a 2.5% conversion rate.
  • The average deal size is $50,000.
  • The operating margin is 10%.

Risks. The following risks can impact the incremental profit generated from new leads attributed to the TEI study:

  • The TEI study cannot generate leads without proper go-to-market activation from the marketing team. A lack of strategy and effort to deploy and use the TEI assets affects the number of new leads and therefore the potential profit. The interviewees who saw the best results were those who created landing pages, highlighted the benefits via social media, set up email campaigns, highlighted the findings via webinar, and other common marketing practices.

Results. To account for these risks, Forrester adjusted this benefit downward by 10%, yielding an 18-month, risk-adjusted total PV (discounted at 10%) of $177,000.

“The TEI study has proven incredibly impactful because of the quality of leads interested in purchasing our solution.”

Director of product marketing, cybersecurity

Incremental Profit From Generating New Leads

Ref. Metric Source 6 Months 12 Months 18 Months
A1 Campaigns per six months Composite 1 1 1
A2 Average leads per campaign for non-TEI assets Interviews 625 625 625
A3 Increase in leads due to the TEI study Interviews 60% 40% 20%
A4 Subtotal: incremental leads due to the TEI study A1*A2*A3 375 250 125
A5 Total leads with TEI campaign A2+A4 1,000 875 750
A6 Average conversions per campaign Interviews 1.00% 1.00% 1.00%
A7 Average conversions per campaign with the TEI study Interviews 2.50% 2.50% 2.50%
A8 Subtotal: total conversions for a non-TEI campaign A2*A6 6 6 6
A9 Total conversions for a TEI campaign A5*A7 25 22 19
A10 Incremental conversions due to the TEI study A8-A9 19 16 13
A11 Average deal size Composite $50,000 $50,000 $50,000
A12 Revenue from non-TEI campaign A8*A11 $312,500 $312,500 $312,500
A13 Subtotal: revenue from TEI campaign A9*A11 $1,250,000 $1,093,750 $937,500
A14 Incremental revenue due to TEI campaign A13-A12 $937,500 $781,250 $625,000
A15 Operating margin Composite 10% 10% 10%
At Incremental profit from generating new leads A14*A15 $93,750 $78,125 $62,500
Risk adjustment ↓10%
Atr Incremental profit from generating new leads (risk-adjusted) $84,375 $70,313 $56,250
18-month total: $210,938 18-month present value: $177,076

“Your experts built [the ROI analysis] for us and put rigor behind the methodology, so it’s got credibility behind it.”

VP of marketing, cybersecurity SaaS

Business Case Development Time Savings

Evidence and data. Decision-makers described the environment before a TEI study, saying that their teams needed a lot of support to create custom business value case studies for prospective clients. With a business case laid out in the TEI study, salespeople could more efficiently build a customer business case for those customers who needed one.

A VP of marketing at a cybersecurity SaaS company told Forrester, “Our salespeople would have either spun their wheels; gotten stuck; or spent 5 hours, 6 hours, 8 hours on a custom ROI exercise.” However, once the TEI was in place, he said that sales teams spent “an hour figuring out the Forrester analysis.”

Furthermore, because the TEI study was available, it alleviated questions that this VP of marketing’s team would have received, giving valuable time back to his employees. He shared this story with Forrester: “It was almost like we were a ‘deal help desk’ where sales would come when they had questions. Now, we don’t get the, ‘Hey, help me do an ROI’ or ‘Where is the ROI spreadsheet?’ Everyone knows to self-help themselves and to go get the TEI.”

Not only did the TEI study provide a clear business value case study for sales to use but it also was a differentiation from competitors as a third-party validation of their solution. Interviewees said that this also helped their sales teams be more efficient because customers were not asking for additional proof points.

A senior director of research and innovation for a software development firm told Forrester: “Among our commercial competitors in our space, we’re the only ones that have third-party validation of the business impact. The Forrester name adds weight and credibility to our business case, which can help with the win rate, and displays a level of professionalism in terms of our communication and selling ability. It gives the buyer confidence that it’s a safe bet for them to go with our company.”

Modeling and assumptions. For the composite organization, Forrester assumes:

  • The composite organization has 200 salespeople on staff. Since this is an 18-month analysis and considering the rate of turnover, we assume that this number stays flat.
  • The number of opportunities per salesperson per cycle is 13.
  • Fifty percent of all opportunities require a business case justification.
  • Prior to the TEI study, salespeople needed 5.5 hours to develop a business case.
  • The reduction in time needed to build custom business case content due to a TEI is 50%.
  • The average fully burdened hourly salary of a sales and marketing employee is $58.

Risks. The following risks can impact the business case development time savings attributed to the TEI study:

  • The number of salespeople.
  • The average number of hours to develop a business value case study.
  • Different amounts of time to create simple business cases versus those that are more complex.

Results. To account for these risks, Forrester adjusted this benefit downward by 15%, yielding an 18-month, risk-adjusted total PV of $133,000.

“Because we have the TEI study, we can tell our salespeople, ‘Here is what you do when pricing comes up. Here is where you justify value.’ We had tried to create our own business case studies, but they were sort of like the poor man’s version of it versus having this ready-made thing that a third party validated. The TEI 100% made our [salespeople’s] lives easier.”

VP of marketing, cybersecurity SaaS

Business Case Development Time Savings

Ref. Metric Source 6 Months 12 Months 18 Months
B1 Number of salespeople Composite 200 200 200
B2 Number of opportunities per salesperson per cycle Composite 13 13 13
B3 Opportunities requiring a business case justification Interviews 50% 50% 50%
B4 Average time to develop a business case (hours) Interviews 5.5 5.5 5.5
B5 Reduction in time needed to build custom business case content due to TEI Interviews 33% 33% 25%
B6 Subtotal: time saved from TEI (hours) D1*D2*D3*D4*D5 2,360 2,360 1,788
B7 Productivity recapture TEI standard 50% 50% 50%
B8 Average fully burdened hourly rate for sales and marketing FTE TEI standard $58 $58 $58
Bt Business case development time savings B6*B7*B8 $67,892 $67,892 $51,434
Risk adjustment ↓15%
Btr Business case development time savings (risk-adjusted) $57,708 $57,708 $43,719
18-month total: $159,136 18-month present value: $133,002

Content Marketing Creation Time Savings

Evidence and data. Decision-makers interviewed for this study shared that if they had not chosen to invest in a TEI, they would have needed to dedicate internal resources to develop an asset with ROI analysis based on substantial data from several customers. Because of this, they saw significant time savings throughout the content process, including savings around roadmapping, scoping, and actual content development (writing, editing, etc.).

A director of product marketing at a cybersecurity company explained how much longer it would take for his internal team to try to create a similar asset. He said: “We had three people working as part of our business value team, and it took twice as long as Forrester was able to deliver the full report. That’s three people, 40 hours a week, for over a year, and they couldn’t produce what Forrester was able to produce. Perhaps they could’ve produced a one- pager that provided some valuable metrics, but it wouldn’t be nearly as complete as a 20-page report that we can display externally.”

Interviewees also commented that the Forrester Consulting team produced a quality product that truly reflected their respective businesses. A marketing and research strategist at an operations management software company explained: “Forrester did their due diligence at the start to understand the products [and] do the internal stakeholder interviews prior to speaking to our customers, and the output was definitely something that I personally found really well-written and articulated in terms of our value proposition and our benefits.”

By having the Forrester team write the study, interviewees said that it helped to solve the internal bandwidth issues their organizations faced. A director of product marketing for a SaaS company told Forrester: “If we were to have our content marketing team and our product marketing team collaborate with our value engineering team, that is three teams and several people that would be involved to create something like this. I imagine that would have taken us upward of six months to work with all the internal stakeholders, which would mean that they’re not working on other projects. I don’t even know if we could have executed this alone without Forrester.”

Modeling and assumptions. For the composite organization, Forrester assumes:

  • There will be five decision-makers (VPs, heads of strategy, etc.) involved in roadmapping cornerstone pieces of content each quarter.
  • The number of hours required to develop the roadmap for cornerstone pieces of content each quarter is 80.
  • The average fully burdened hourly salary of an executive is $128.
  • The composite organization dedicates two employees to developing marketing content, and it takes them 500 hours to develop a cornerstone piece.
  • The average fully burdened hourly salary of a marketing employee is $48.

Risks. The following risks can impact the content marketing creation time savings attributed to the TEI study:

  • The number of marketers needed to create content for the organization.
  • The ability for the internal team to accurately portray the value proposition with each piece of content they roadmap. If stakeholders ren’t aligned with concept, it will take longer for marketers to write the piece and tweak accordingly based on the feedback they receive.

Results. To account for these risks, Forrester adjusted this benefit downward by 15%, yielding an 18-month, risk-adjusted total PV of $58,000.

“The Forrester TEI study is the only third- party asset that was well-written. I’ve been engaged with six or seven in the last year and a half, and it’s the only one that was well-written. They actually understood what we did, and we didn’t have to make any tweaks.”

Director of product marketing, telecommunications services

Content Marketing Creation Time Savings

Ref. Metric Source 6 Months 12 Months 18 Months
C1 FTEs involved in roadmapping cornerstone marketing content Composite 5
C2 Time required to develop the roadmap for one cornerstone marketing asset per quarter (hours) Interview 80
C3 Time savings due to collaborating with TEI consultants Interviews 20%
C4 Average fully burdened executive hourly salary TEI standard $128
C5 Subtotal: content creation roadmapping savings due to TEI C2*C3*C4 $2,046
C6 Marketing FTEs dedicated to developing marketing content Composite 2
C7 Time required to develop marketing content (writing, scoping, editing, etc.) (hours) Interviews 500
C8 Percentage of hours saved due to TEI team Interviews 95%
C9 Average fully burdened marketing FTE hourly salary TEI standard $48
C10 Subtotal: marketing team efficiency gains C7*C8*C9 $22,837
C11 Average third-party agency fees avoided Interviews $50,000
Ct Content marketing creation time savings $74,883 $0 $0
Risk adjustment ↓15%
Ctr Content marketing creation time savings (risk- adjusted) $63,650 $0 $0
18-month total: $63,650 18-month present value: $57,864

Incremental Profit From Generating New Leads With The TEI Calculator

Evidence and data. Some of the decision-makers interviewed for this study also purchased a derivative of the TEI study known as the TEI calculator. This asset provides a personalized expectation of the benefits and ROI an organization would see if it invested in a solution.

While Forrester’s composite organization provides an estimated ROI and benefits, it’s sometimes difficult for companies that don’t match the composition of the composite organization to see themselves in the results. For example, if the composite organization is a larger corporation and the prospect reading the study is at a small business, some of the assumptions would not align.

As a result, Forrester created a TEI calculator where a prospect can input their company’s characteristics to get a more personalized estimate. Because not all customers interviewed for this study purchased the calculator, Forrester did not include this benefit in the financial model. However, to demonstrate the impact for this benefit category, Forrester calculated an example that readers can use to further estimate positive impact and ROI (see Table D).

Interviewees said that their sales teams appreciated the credibility of the real-world data that the calculator provides. The TEI calculator is hosted on an independent, third-party site and not on the company’s website. This provided increased credibility as prospective customers would see the Forrester logo and have more trust in the results. Two interviewees spoke to this.

  • A VP of marketing for a cybersecurity SaaS company said, “The calculator pairs really well with our risk assessment because instead of estimating numbers and making things up, we take the output of a client’s real risk assessment, and then we plug that data into the Forrester calculator, and it gives them the ROI.”
  • A solution marketing leader for value at a service cloud company said: “We had a call with about 500 salespeople on a webcast a couple of quarters ago. I asked them during a poll, ‘Is it important to you to have third-party certification of our value models on the calculator?’ And 95% said yes — that absolutely, credibility was the number one thing.”

Another feature of the calculator that interviewees appreciated was the ability to track leads. Decision- makers provided intake forms to their CRM tools to the Forrester team to embed in the calculator so they could see who was engaging with it.

Modeling and assumptions. For the composite organization, Forrester assumes:

  • The average number of leads per campaign for a non-TEI asset is 625.
  • There is a 40% increase in leads due to the TEI calculator in the first six months. This will stay steady as more people are exposed to the calculator and remains at 40% for 12 months. After that, at 18 months, the composite organization will see only a 30% increase.
  • The average conversion rate per campaign with the TEI study and calculator is 5%.
  • The average deal size is $50,000.
  • The operating margin is 10%.

Risks. The following risks can impact the incremental profit from generating new leads attributed to the TEI calculator:

  • A shorter PDF report is generated when a prospect uses the calculator; however, it doesn’t come with the richness of the study itself. A director of product marketing at a telecommunications services company said their team felt that one needed the study (along with the calculator) to capture the details and stories. Some organizations do not use the calculator as a lead-generation tool; rather, they may use a version of the TEI calculator for sales enablement, which would affect the impact and results.
  • Companies are responsible for promoting the calculator, and the number of leads will be affected by marketing’s strategy and support of the asset.

Results. To account for these risks, Forrester adjusted this benefit downward by 10%, yielding an 18-month, risk-adjusted total PV of $129,000.

Revenue from 13 additional lead conversions in six months:

$625,000

Incremental Profit From Generating New Leads With The TEI Calculator

Ref. Metric Source 6 Months 12 Months 18 Months
D1 Campaigns per six months Composite 1 1
D2 Average leads per campaign for non-TEI assets Interviews 625 625
D3 Increase in leads due to the TEI calculator Interviews 40% 40%
D4 Subtotal: incremental leads to the TEI calculator D2*D3 250 250
D5 Average conversions per campaign Interviews 1.00% 1.00%
D6 Average conversions per campaign with the TEI study and calculator Forrester data 5% 5%
D7 Total conversions for a non-TEI campaign D2*D5 6 6
D8 Total conversions attributed to the TEI calculator D4*D6 13 13
D9 Average deal size Composite $50,000 $50,000
D10 Incremental revenue due to the TEI calculator D8*D9 $625,000 $625,000
D11 Operating margin Composite 10% 10%
Dt Incremental profit from generating new leads with the TEI calculator D10*D11 $0 $62,500 $62,500
Risk adjustment ↓10%
Dtr Incremental profit from generating new leads with calculator (risk-adjusted) $0 $56,250 $56,250
18-month total: $154,688 18-month present value: $129,320

Unquantified Benefits

Additional benefits that customers experienced but were not able to quantify include:

  • Engaged decision-makers who were otherwise uncertain or reluctant to make a purchase. Buyers now exercise greater scrutiny over vendor solutions than ever before, with more people involved in the process.5 Furthermore, many technology purchases inherently affect a broader swath of functions, departments, and business areas, bringing more stakeholders to the mix.6 Interviewees shared with Forrester that the TEI delivered personalized messaging for many members of the buying group — here are some of their reflections.

  • The senior director of research and innovation at a software development company said: “It’s a tough job selling and convincing people of the value of a relatively expensive B2B product. We’re selling a technical product to a very technical buyer. The buyers of our product — engineers and software developers — don’t normally think in economic terms. It is very important for us to help them see a bigger picture. Introducing financial value into conversations of what otherwise would be a very technical discussion is quite important. The Forrester TEI study shows the impact for their team in the economic terms they need.”
  • The director of product marketing at a SaaS firm shared: “One of our sales reps said that the TEI study helped him to reengage and get some stalled deals unstuck. The deal was likely not going anywhere, and the customer was thinking about going to the status quo of not doing anything. They then saw this ROI and the value and reengaged with us. So a deal that otherwise just would have gone away has reinvested themselves in our product.”
  • The VP of marketing for a cybersecurity SaaS company noted: “The top benefit is definitely the ability to help our champions justify the purchase of our solution. That’s the main reason we bought the TEI as it gets us past that hurdle in the deal cycle. Whether it’s giving it to the procurement people or giving it to our champion to articulate to their CFO, that’s what it’s used for that’s the main benefit that we see.”
  • Elevated brand awareness across the customer lifecycle. Interviewees said that because the TEI study can speak to different stages of the buyer’s journey, marketing teams could be creative in how they utilized the study. Many called out the benefits on social media to drive downloads of the TEI study. Others said their sales teams were able to have better conversations with existing customers because the study helped remind them of the value they had in working with their organizations.

  • Created consistency and alignment around companies’ value propositions. Interviewees said that creating consistent messaging around their value propositions was a key benefit of commissioning a Forrester TEI study.

  • A senior director of research and innovation at a software development firm said, “The Forrester TEI study is a cornerstone to our corporate strategy of organizing around value-selling.” He went on to explain how the study has allowed his team to focus on their strategy: “We have been trying to organize our product strategy, marketing strategy, company strategy, and so forth around value- selling. We wanted to tell a fuller story around how our product could benefit people, using an economic lens. That’s quite critical to us from a strategic point of view, just in terms of our internal organization and external communications. We see [the TEI study] as a really strategic aspect.”
  • A director of product marketing for a telecommunications services company shared how the TEI study helped her organization drive consistency: “What we do is pretty complex, and I think in the past, we tried to boil the ocean and tell you everything. Now we’re more consistent with what we say we do and how we help our clients. We really anchor around what you get and the benefits of working with us. With the TEI, we start with the benefits and we lead with the benefits.”
  • Supplied primary research and actual voice- of-the-customer data and feedback. Having customer insights allows organizations to better meet their customers’ needs and deliver more rewarding experiences.

  • Interviewees shared that by including customer perspective and quotes in the TEI study, it highlighted peer successes to prospects. A global director of product marketing for a legal technology firm said, “I had a legal operations executive at one of the top financial institutions in the world tell me that the report was invaluable for communicating the importance of our product to their legal team.”

Flexibility

The value of flexibility is unique to each customer. There are multiple scenarios in which a customer might implement a TEI study and later realize additional uses and business opportunities, including:

  • Providing sales with self-service business case studies and tools. With the ongoing trends around the employee attrition, companies will continue to experience more turnover.7 That, combined with an anywhere-work model, means that sales enablement teams need to provide resources so newer sales reps can learn and train autonomously. Interviewees said that by having the TEI study, their sales representatives have an easy-to-use, pre-vetted business value case study, meaning newer team members can more quickly influence pipeline.

  • A VP of marketing for a cybersecurity SaaS company said: “My sales team knows they can go into our library, search for ROI, and two things appear: the TEI PDF and a link to a calculator. They can go and learn it themselves, and they have a tool in their toolbox to fight pricing objections.”
  • Using the Forrester TEI analysis to validate internal ROI models. More and more companies are hiring business value engineers to create ROI analyses internally; however, it’s hard to get these claims verified. A solution marketing leader for value at a service cloud company reached out to Forrester and asked if the TEI team could validate their internal models. He said: “We were pushing the boundaries, and you guys were amenable to that. It was similar to a typical TEI project except there was no actual TEI study at the end. Instead, we have a PDF on Forrester paper that shows the Forrester team verified our claims, which allows us to have more credibility in the marketplace.”

Flexibility would also be quantified when evaluated as part of a specific project (described in more detail in Appendix A).

Total Costs

Ref. Costs Initial 6 months 12 months 18 months Total
Etr Multicustomer case study TEI with infographic fees $137,500 $0 $0 $0 $137,500
Ftr Internal labor costs for the TEI project $19,668 $0 $0 $0 $19,668
Total costs (risk-adjusted) $157,168 $0 $0 $0 $157,168

Multicustomer Case Study TEI With Infographic Fees

Evidence and data. The composite organization's spend on the Forrester TEI study includes the content development cost for a multicustomer case study (with four customer interviews) as well as an infographic. This cost also includes:

  • A review of the composite organization’s documentation, including value proposition collateral; product marketing playbooks, one- pagers, etc.; sales pitch decks, battle cards, and tools; product features, data sheets, and demos; videos and case studies; existing ROI analysis, tools, and business cases; standard and list pricing; and other content the client deems worthy for the Forrester Consulting team to review.
  • A partnership between the consultant and a Forrester subject matter expert. Forrester’s TEI studies are research-backed, and the Consulting team works with the appropriate Forrester analyst to ensure they understand the composite organization’s business, industry, and market conditions.
  • Four conversations with various stakeholders across the composite organization who can best articulate the value proposition, go-to-market strategy, and target audience. The project includes:
  • Four, 1-hour customer interviews in which the Consulting team discusses the costs, benefits, future flexibility, and risk assessment of the composite organization’s technology.
  • Based on the data collected during those customer interviews, a financial analysis of the composite organization's benefits, costs, future flexibility, and perceived risks.
  • A written case study that includes the financial analysis along with supporting tables, various metrics, and voice-of-the-customer quotes.
  • An infographic, which is a one-page summary of the TEI findings, collaboratively designed to include the most impactful data from the TEI study. This can be used to tell an adjacent story, but it is also helpful to sales and marketing’s go-to-market efforts.

Moreover, the composite organization has access to Forrester’s Consulting team, which is available to answer questions, address concerns, and help the composite organization navigate the nuances of process and the study.

Modeling and assumptions. This section explains how the modeling is done.

  • Based on the composite organization’s size and needs, it opts to purchase a multicustomer case study and an infographic; its marketing team can create additional go-to-market assets to help activate the study and drive leads.
  • These costs are for 2022; prices may change in the future.

Risks. The following risks can impact the TEI study and infographic costs:

  • A standard multicustomer case study has Forrester interviewing four customers; the cost will increase if companies opt to have Forrester interview additional customers.

Results. To account for these risks, Forrester adjusted this cost upward by 10%, yielding an 18-month, risk- adjusted total PV (discounted at 10%) of $137,500.

Multicustomer Case Study TEI With Infographic Fees

Ref. Metric Source Initial 6 Months 12 Months 18 Months
E1 Multicustomer case study TEI with infographic fees Composite $125,000 $0 $0 $0
Et Multicustomer case study TEI with infographic fees E1 $125,000 $0 $0 $0
Risk adjustment ↑10%
Etr Multicustomer case study TEI with infographic fees (risk-adjusted) $137,500 $0 $0 $0
18-month total: $137,500 18-month present value: $137,500

Internal Labor Costs For The TEI Project

Evidence and data. While Forrester’s Consulting team does the lion’s share of the work, the interviewees noted that the project still required internal labor from their respective marketing teams. These internal costs are described below.

To ensure the success of a TEI project, decision- makers said that it was important for them to ensure that their stakeholders were internally aligned with their companies’ value proposition and key benefits. This provided clearer feedback around the customer interview guide as well as which customers to ask to participate in the process.

One of the most time-consuming parts of the TEI process was finding and soliciting appropriate customers who could tell a strong before-and-after story about the decision-makers’ companies’ products. Interviewees engaged in a discovery and customer interview search that for some lasted eight weeks (with an hour of their time dedicated to finding the right customers). Said a global director of product marketing at a legal technology firm, “It took awhile to get the right customer mix.”

Once the Forrester Consulting team wrote the study, decision-makers and their teams reviewed the TEI study (as well as any associated deliverables) and provided feedback.

As with any other pillar piece of marketing content, the decision-makers’ marketing teams created go-to- market campaigns and associated collateral for the TEI study. This meant that their employees created landing pages, social media posts, social media images, emails, press releases, and more.

  • Because of the investment in the TEI study, many decision-makers stressed the importance of offering additional training for their sales team to ensure they could speak to the benefits and financial analysis at a high level. A director of product marketing for a SaaS company said: “I talked through TEI study and the assets that we created around it. We created scripts that our SDRs [sales development reps] could instantly send to their customers. We have a cheat sheet. Basically, I gave them this packet of goodies (FAQs, scripts, etc.) and spent time with the folks wanting to get some more information and had follow-up questions.”

Some interviewees purchased a sales training webinar (a 1-hour training session with a Forrester sales enablement expert who can coach sales teams on how to get value from the TEI study). Said a director of product marketing at a telecommunications services company, “We did some internal training, and we did a Forrester-led webinar, so there was a fair amount of education in how to leverage the study and then share the asset itself and the lead-gen tool.”

Modeling and assumptions. For the composite organization, Forrester assumes:

  • Stakeholders spend 30 hours scoping the TEI project to ensure they are aligned with the value proposition and key benefits, thus avoiding confusion and delays.
  • The composite organization’s customers can speak to Forrester about their respective before-states and the benefits they saw once they implemented the technology, including appropriate metrics.
  • The composite organization will treat the TEI ampaign like any other campaign for a pillar piece of content. This means that they create both organic and paid media (social media, press releases, SEO ads, etc.) campaigns. Since this is normal behavior, Forrester does not include paid media campaigns as a separate cost.
  • The composite organization designates three marketing employees to the TEI project who will create marketing content to activate the TEI study.
  • The composite organization dedicates at least 1 hour to help train sales employees on how to use the TEI study.
  • The average fully burdened hourly rate of a marketing team member is $60.

Risks. The following risks can impact the composite organization’s internal labor costs:

  • The ability to find and source the right customers to speak with Forrester can significantly delay the TEI process and corresponding project timeline. Forrester recommends that any company seeking to develop a TEI study has customers in mind (and potentially vets them) before embarking on the TEI process.8
  • Companies must collaborate internally to ensure alignment around the key benefits they’d like Forrester to inquire about during the customer interviews, so consultants can hone their approach.

Results. To account for these risks, Forrester adjusted this cost upward by 10%, yielding an 18-month, risk- adjusted total PV of $19,700.

“You have to find thoughtful customers who can assess the solution at a strategic level, will tell the right story, and are willing to share their insights.”

Global director of product marketing, legal technology

Internal Labor Costs For The TEI Project

Ref. Metric Source Initial 6 Months 12 Months 18 Months
F1 Total time spent scoping the TEI project (hours) Interviews 30
F2 Time spent on customer interview phase (hours) Interviews 12
F3 Time spent on finalizing the TEI case study and associated deliverables (hours) Interviews 24
F4 Time spent creating marketing content for TEI case study and associated deliverables (hours) Interviews 24
F5 Marketing team members involved in sales training Composite 2
F6 Sales employees Composite 200
F7 Time spent training sales employees on TEI case study (hours) Interviews 1
F8 Time dedicated to sales training across four sessions to choose from (hours) (F5*F7+4)+(F6*F7) 208
F9 Subtotal: time dedicated to the creation and marketing and sales enablement of the TEI study (hours) F1+F2+F3+F4+F8 298
F10 Average fully burdened hourly rate of a marketing team member TEI standard $60
Ft Internal labor costs for the TEI project F9*F10 $17,880 $0 $0 $0
Risk adjustment ↑10%
Ftr Internal labor costs for the TEI project (risk-adjusted) $19,668 $0 $0 $0
18-month total: $19,668 18-month present value: $19,668

  • icon

    These risk-adjusted ROI, NPV, and payback period values are determined by applying risk-adjustment factors to the unadjusted results in each benefit and cost section.

Cash Flow Chart

Total costs Total benefits Cumulative net benefits

Cash Flow Table (Risk-Adjusted)

Initial Year 1 Year 2 Year 3 Total Present Value
Total Costs ($157,168) $0 $0 $0 ($157,168) ($157,168)
Total Benefits $0 $205,734 $128,021 $99,969 $433,723 $367,942
Net Benefits ($157,168) $205,734 $128,021 $99,969 $276,555 $210,774
ROI 134%
Payback Period < 6

The initial investment column contains costs incurred at “time 0” or at the beginning of Year 1 that are not discounted. All other cash flows are discounted using the discount rate at the end of the year. PV calculations are calculated for each total cost and benefit estimate. NPV calculations in the summary tables are the sum of the initial investment and the discounted cash flows in each year. Sums and present value calculations of the Total Benefits, Total Costs, and Cash Flow tables may not exactly add up, as some rounding may occur.

Appendix A: Total Economic Impact

Total Economic Impact is a methodology developed by Forrester Research that enhances a company’s technology decision-making processes and assists vendors in communicating the value proposition of their products and services to clients. The TEI methodology helps companies demonstrate, justify, and realize the tangible value of IT initiatives to both senior management and other key business stakeholders.

Total Economic Impact Approach

  • icon

    Benefits represent the value delivered to the business by the product. The TEI methodology places equal weight on the measure of benefits and the measure of costs, allowing for a full examination of the effect of the technology on the entire organization.

  • icon

    Costs consider all expenses necessary to deliver the proposed value, or benefits, of the product. The cost category within TEI captures incremental costs over the existing environment for ongoing costs associated with the solution.

  • icon

    Flexibility represents the strategic value that can be obtained for some future additional investment building on top of the initial investment already made. Having the ability to capture that benefit has a PV that can be estimated.

  • icon

    Risks measure the uncertainty of benefit and cost estimates given: 1) the likelihood that estimates will meet original projections and 2) the likelihood that estimates will be tracked over time. TEI risk factors are based on “triangular distribution.”

  • icon
    PRESENT VALUE (PV)

    The present or current value of (discounted) cost and benefit estimates given at an interest rate (the discount rate). The PV of costs and benefits feed into the total NPV of cash flows.

  • icon
    NET PRESENT VALUE (NPV)

    The present or current value of (discounted) future net cash flows given an interest rate (the discount rate). A positive project NPV normally indicates that the investment should be made, unless other projects have higher NPVs.

  • icon
    RETURN ON INVESTMENT (ROI)

    A project’s expected return in percentage terms. ROI is calculated by dividing net benefits (benefits less costs) by costs.

  • icon
    DISCOUNT RATE

    The interest rate used in cash flow analysis to take into account the time value of money. Organizations typically use discount rates between 8% and 16%.

  • icon
    PAYBACK PERIOD

    The breakeven point for an investment. This is the point in time at which net benefits (benefits minus costs) equal initial investment or cost.

The initial investment column contains costs incurred at “time 0” or at the beginning of Year 1 that are not discounted. All other cash flows are discounted using the discount rate at the end of the year. PV calculations are calculated for each total cost and benefit estimate. NPV calculations in the summary tables are the sum of the initial investment and the discounted cash flows in each year. Sums and present value calculations of the Total Benefits, Total Costs, and Cash Flow tables may not exactly add up, as some rounding may occur.


Appendix B: Endnotes

1 Source: Forrester Consulting’s Q3 2019 Global Marketing Content Credibility Study, Forrester Research, Inc.

2 Ibid.

3 Source: “The Forrester Revenue Engine Strategy Compass Template,” Forrester Research, Inc., August 24, 2021.

4 Source: “Creating Journey Maps To Enable Buying Decisions,” Forrester Research, Inc., January 1, 2018.

5 Source: “Forrester’s 2021 B2B Buying Study Reveals Seismic Shifts That Amplify Long-Term Trends In Buying Behavior,” Forrester Research, Inc., May 13, 2021.

6 Ibid.

7 Source: Eric Zines, “Sales Enablement And The Great Resignation — Three Things You Need To Do NOW,” Forrester Blogs.

8 Source: Sam Sexton, “Be Early, Be Empathetic: How To Show Your Customers The Value Of Participating In A Forrester TEI,” Forrester Blogs

Cookie Preferences

Accept Cookies

A cookie is a small text file that a website saves on your computer or mobile device when you visit the site. It enables the website to remember your actions (data inputs, website navigation), so you don’t have to re-enter data when you come back to the site or browse from one page to another.

Behavioral information collected by our web analytics vendor is used to analyze data pertaining to visitor trends, plan website enhancements, and measure overall website effectiveness. We may also use cookies or web beacons to help us offer you products, programs, or services that may be of interest to you and to deliver relevant advertising. We may use third-party advertising companies to help tailor website content to users or to serve ads on our behalf. These companies may also employ cookies and web beacons to measure advertising effectiveness.

Please accept cookies and the collection of behavioral information to receive full functionality and enhance your experience. If you decline cookies, some features of the website may not function normally.

Please see our Privacy Policy for more information.