The Total Economic Impact™ Of Cisco Full-Stack Observability
Cost Savings And Business Benefits Enabled By Cisco Full-Stack Observability
A Forrester Total Economic Impact™ Study Commissioned By Cisco, May 2024
The availability of cloud computing has led to on-prem migration efforts and an exponential explosion of telemetry data across hybrid cloud environments.1 Observability enables organizations to gain valuable insights into a system’s internal states and behaviors, which can empower them to take proactive measures and enhance their understanding of performance. As infrastructure and business-critical applications become increasingly complex, organizations are leveraging AIOps and observability to prevent incidents and drive value within their operations. Through the deployment of Cisco Full-Stack Observability, organizations can reduce costs associated with tool consolidation, improve system performance resulting in fewer outages, decrease mean time to resolve (MTTR) issues, and avert revenue loss.
Cisco Full-Stack Observability (Cisco FSO) is an observability portfolio that includes Cisco AppDynamics, Cisco ThousandEyes, and a multitude of supportive services. As a comprehensive monitoring and observability suite, it is tailored for complex IT environments and designed to provide high-performance IT organizations with complete visibility and insights across their infrastructure stack including applications, networks, servers, and cloud environments. AppDynamics serves as an application performance monitoring (APM) and IT operations analytics (ITOA) platform, which enables proactive resolution of application performance issues across the entire enterprise. Additionally, because ThousandEyes serves as the network intelligence for Cisco FSO, it offers valuable insights into the performance and security of an organization’s digital infrastructure. By leveraging Cisco Full-Stack Observability, organizations can gain a comprehensive understanding of their IT infrastructure with contextual insights, ensuring the seamless functioning of their applications and services.
Cisco commissioned Forrester Consulting to conduct a Total Economic Impact™ (TEI) study and examine the potential return on investment (ROI) enterprises may realize by deploying a Cisco Full-Stack Observability solution.2 The purpose of this study is to provide readers with a framework to evaluate the potential financial impact of Cisco Full-Stack Observability on their organizations.
Return on investment (ROI)
359%359%
Net present value (NPV)
$44.4M$44.4M
To better understand the benefits, costs, and risks associated with this investment, Forrester interviewed four representatives with experience using Cisco FSO. For the purposes of this study, Forrester aggregated the interviewees’ experiences and combined the results into a single composite organization that is a retail organization with 50,000 employees and revenue of $20 billion per year. The composite organization has a hybrid infrastructure environment, and it monitors 125 applications with Cisco FSO solutions.
has in annual revenue and 0 apps to be monitored by Cisco FSO solutions. Custom results are based on these inputs and the TEI case study.
Interviewees said that prior to using Cisco FSO, their organizations lacked visibility into siloed people, processes, and technology and that they often could not determine if something was a root cause or a system issue when encountering an incident, including major outages. As a result, when various teams gathered in war-room environments without a means to identify the issue properly and efficiently, the default mode of operation was finger-pointing. Moreover, the interviewees said their organizations relied on customer reports to become aware of service problems and outages, which risked brand reputation and customer retention even more. The migration to the cloud further exacerbated the problem because visibility into on-premises systems was lost. Previous attempts to address these issues had limited success, which left the organizations with complex IT problems, high costs, unsustainable processes, and lost revenue.
The interviewees said that after the investment in Cisco FSO, their organizations experienced significant improvements. They shared that they now have comprehensive visibility into their infrastructure, applications, and services. Moreover, the investment in Cisco FSO yielded positive outcomes, such as consolidating legacy systems, increasing efficiency in the war room, avoiding revenue loss, and increasing team productivity.
Key Findings
Quantified benefits. Three-year, risk-adjusted present value (PV) quantified benefits for the composite organization include:
- Retirement of 65% of legacy tools by the end of Year 3. By implementing Cisco FSO, the composite organization gradually phases out outdated, antiquated, and siloed legacy monitoring tools while consolidating redundant technologies. This not only eliminates the need for licensing fees, but it also reduces infrastructure and maintenance costs. Over three years, the composite organization saves $19.2 million by eliminating tool sprawl and streamlining maintenance processes.
might save by eliminating tool sprawl and streamlining maintenance processes.
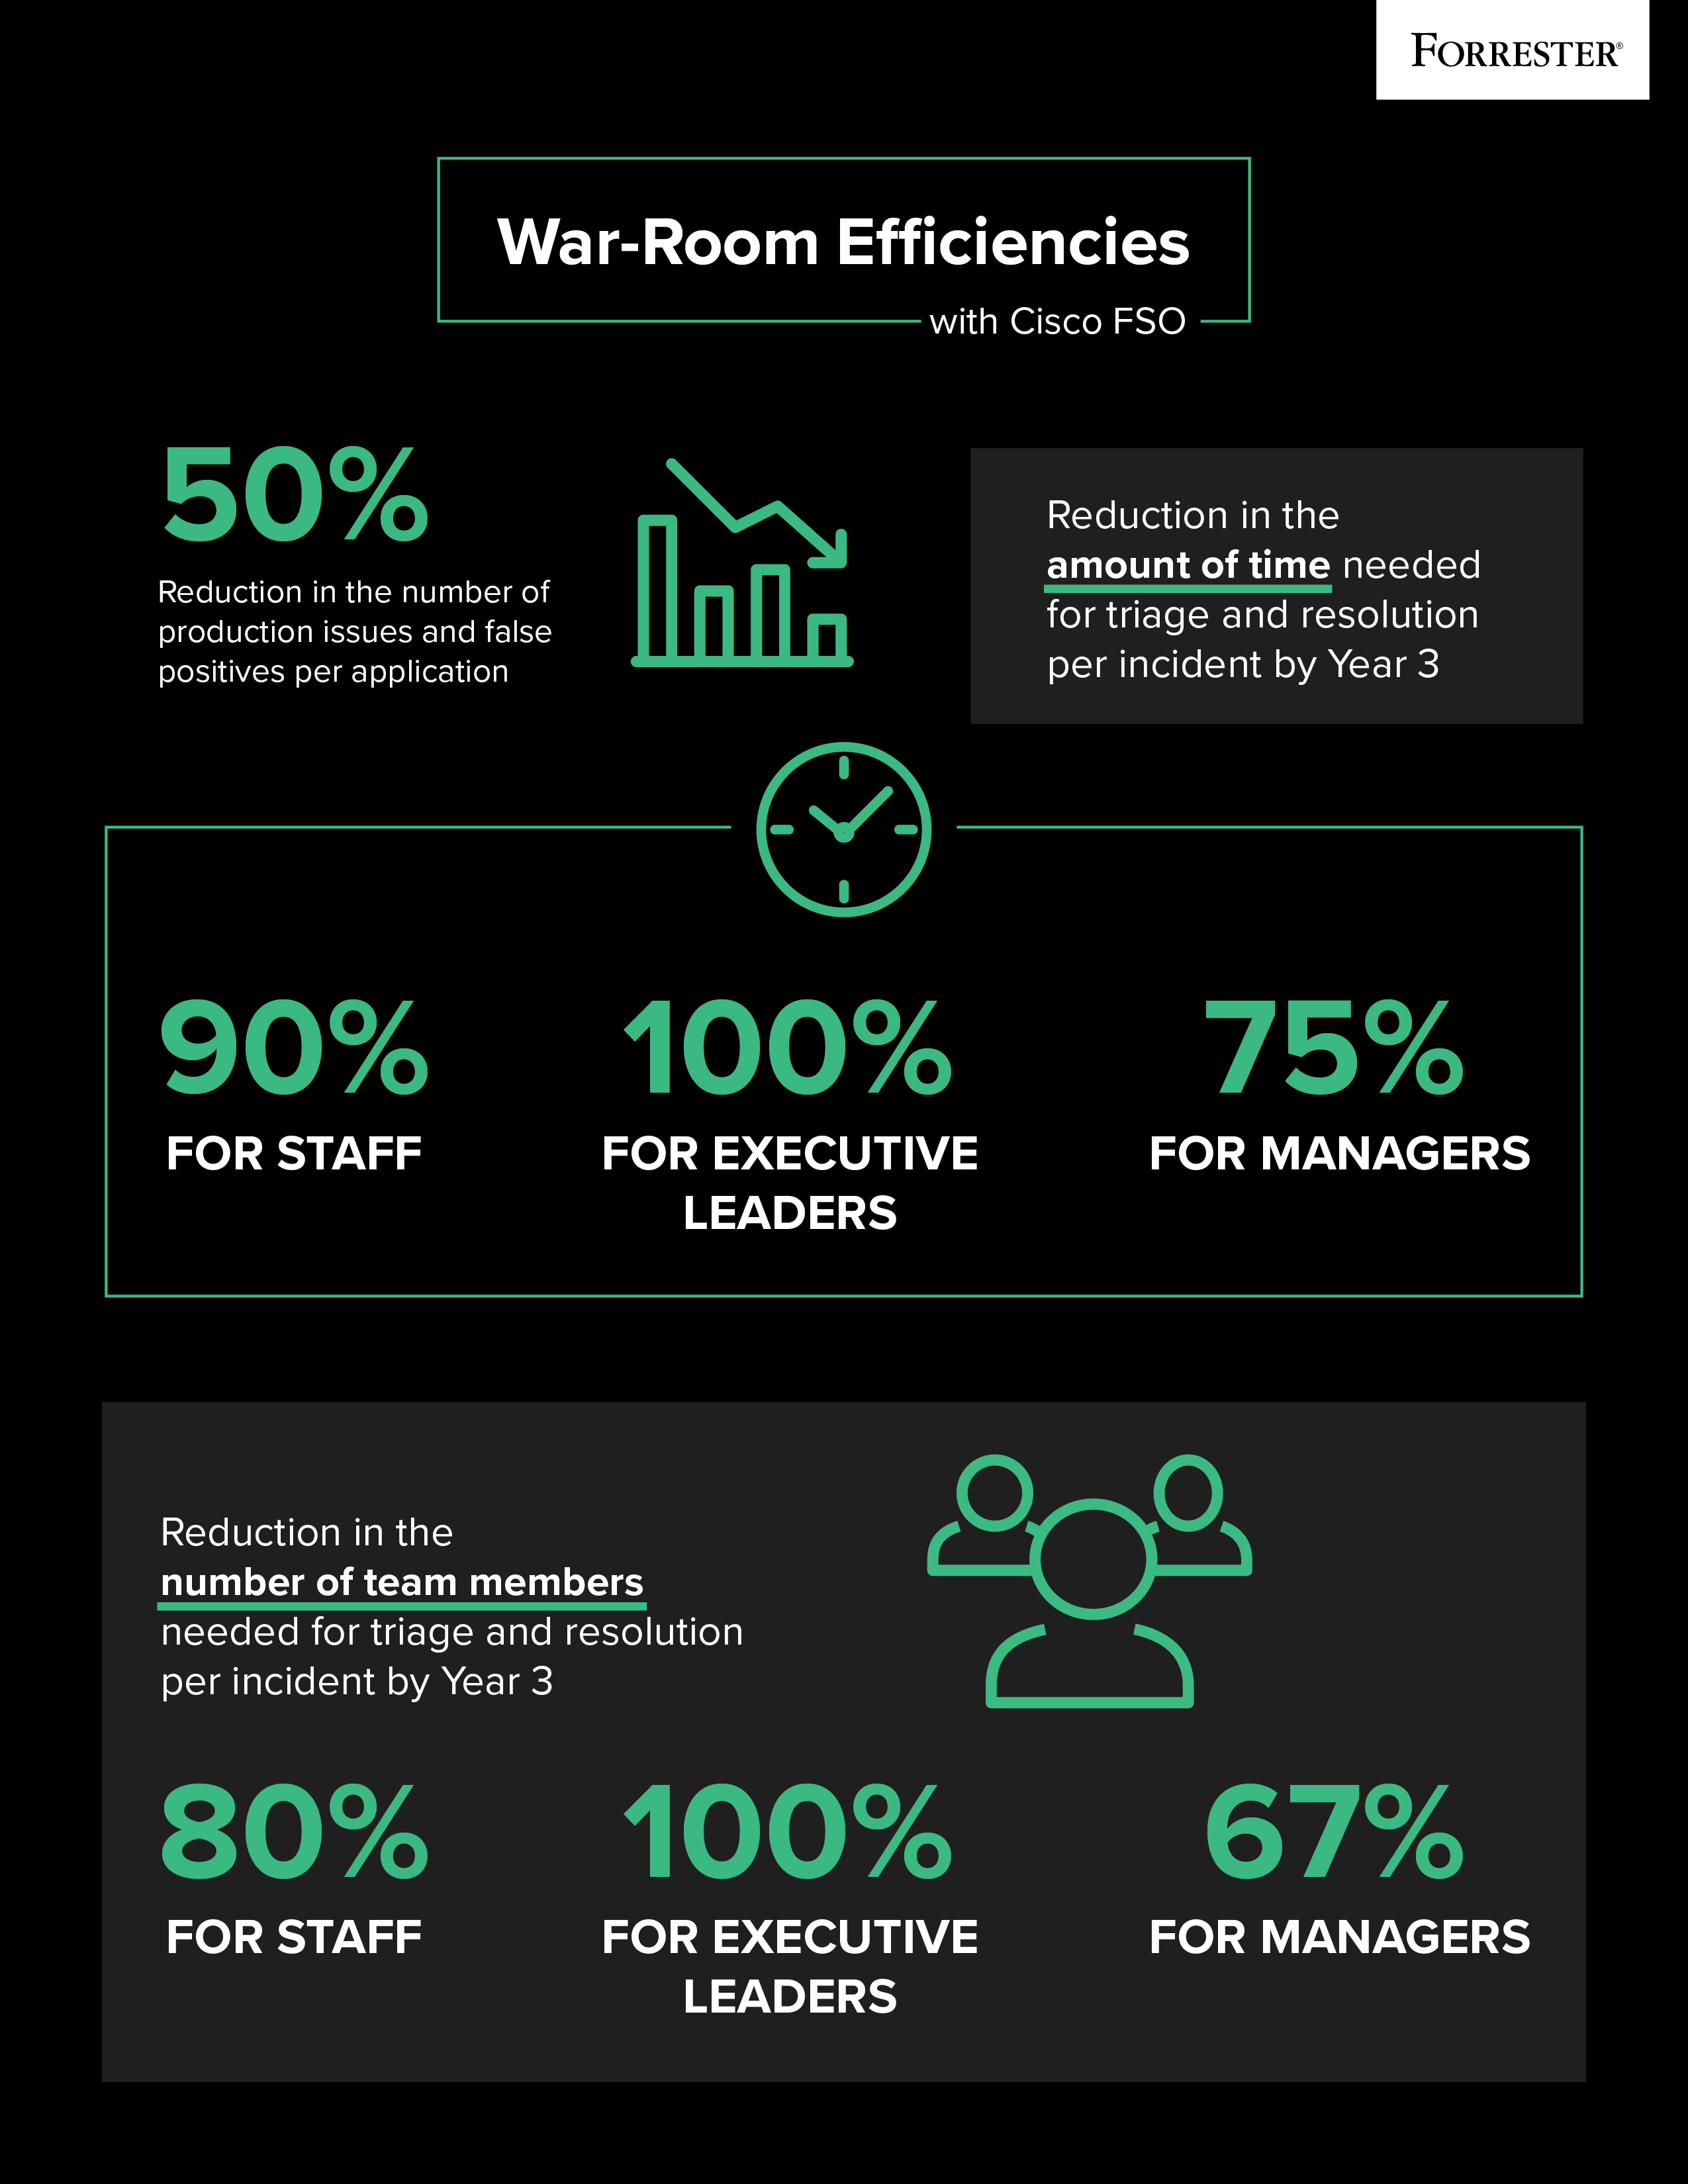
- Improvement in incident prevention of 50% and a 90% decrease in MTTR, which leads to labor savings of $13.9 million. Cisco FSO empowers the composite organization with real-time visibility and contextual insights into systems and applications, which enables the identification of issues within minutes and allows the internal war room team to save time triaging and resolving incidents. Additionally, using Cisco FSO also allows the composite organization to reduce production issues and false positives by 50%.
might save from improved incident prevention and decreased MTTR.
- Reduction in the likelihood of revenue-impact outages by 50% and a 60% reduction in the average length of a major outage by the end of Year 3, valued at $22.5 million. By implementing Cisco FSO, the composite organization not only gains insight into its applications that directly drive revenue, but it also experiences a significant decrease in the number of outages. This eliminates the need to rely on customer-reported issues. Furthermore, Cisco FSO reduces the average length of the composite’s major outages, which helps it avoid additional revenue loss. Over three years, the composite organization saves $22.5 million in avoided revenue loss due to outage prevention.
might save due to reductions in the likelihood and length of revenue-impacting outages.
- Internal resource efficiency and productivity increase of 30% enabled through Cisco certifications. With access to Cisco certified training and Cisco University (Cisco’s virtual university platform that offers courses specifically focused on Cisco technologies), the composite’s internal staff increases its knowledge of and efficiency with the solutions. Also, through learnings gained by taking the courses, the capacity of the internal staff increases year over year. Over three years, the composite organization saves $1.1 million in internal resource efficiency and productivity.
might save with staff productivity increases enabled through Cisco certifications.
Unquantified benefits. Benefits that provide value for the composite organization but are not quantified for this study include:
- Improved employee experience. With Cisco FSO, the composite’s IT team experiences a reduction in urgent calls received after business hours and eliminates the need to perform mundane, repetitive tasks with Cisco’s data-analytics and automation capabilities. This allows team members to handle issues more efficiently and effectively during business hours and to not have to join a call in the middle of the night. Moreover, this also alleviates some of the burden on key go-to resources who participate in every event that arises. As a result, these resources can reallocate their time towards more valuable and productive tasks.
- Enhanced brand reputation. By experiencing fewer issues and outages, the composite organization witnesses a notable decrease in disruptions to its operations. As a result, its customers enjoy uninterrupted services, which leads to enhanced satisfaction. In turn, this contributes to strengthening the composite’s brand reputation.
- Transformed to a proactive and preventative state. The implementation of Cisco FSO transforms the composite organization’s approach from reactive to proactive, which enables it to prevent issues and outages before they occur. This shift has a profound impact on the organization’s internal culture and fosters a proactive mindset and focus on prevention rather than firefighting. This positive shift in culture contributes to improved efficiency, productivity, and an overall shift towards being a high-performance IT organization.
- Solidified departmental alignment and cross-team collaboration. The composite’s cross-functional team members are able to communicate more effectively with Cisco FSO’s user-friendly dashboard regardless of their background or role. The underpinning of a common source of data and insights reduces discrepancies and conflicting viewpoints of data. This significant improvement in collaboration results in shorter war-room durations or even eliminates them altogether.
- Accelerated cloud transition and expansion of business operations. The implementation of Cisco FSO boosts the composite organization’s confidence in its hybrid infrastructure, leading to a faster transition to the cloud. Contextual real-time insights provide awareness of system operations and interactions for more informed decision-making. This transition results in improved business operations and better overall business outcomes for the organization.
- Valued customer partnership with Cisco. Cisco collaborates with the composite organization to meet the growing demand for observability, and the composite’s technology teams wholeheartedly support Cisco solutions with strong buy-in from executives. This partnership ensures a unified and enthusiastic approach to leveraging Cisco offerings for improved observability capabilities.
Costs. Three-year, risk-adjusted PV costs for the composite organization include:
- Cisco FSO licensing and hybrid environment costs valued at $9.4 million. The composite pays licensing fees for AppDynamics and ThousandEyes based on a three-year plan and ongoing Cisco professional services fees to provide comprehensive support. Additionally, the composite pays other costs associated with supporting its hybrid application environment.
For , Cisco FSO licensing and hybrid environment costs might be .
- AppDynamics implementation and ongoing management costs valued at $1 million. The composite organization needs an internal team of six people to implement AppDynamics. During the proof of concept (POC), the composite organization opts to implement five applications on AppDynamics so that 125 are monitored by the solution by the end of Year 3. After the implementation, one system administrator is responsible for the ongoing management.
For , AppDynamics implementation and ongoing management costs might be .
- ThousandEyes implementation and ongoing support costs valued at $1.8 million. Eight DevOps employees at the composite organization implement ThousandEyes over the course of two weeks while four professionals provide ongoing maintenance.
For , ThousandEyes implementation and ongoing support costs might be .
- Cisco FSO training costs valued at $249,000. Because ongoing training is essential to fully leveraging the capabilities of the system, the 14 employees responsible for implementing both AppDynamics and ThousandEyes require a week of training on each solution, respectfully. These same individuals opt to gain Cisco certification to ensure the composite organization can make the most out of the system and optimize its usage.
For , Cisco FSO training costs might be .
The representative interviews and financial analysis found that a composite organization experiences benefits of $56.80 million over three years versus costs of $12.40 million, adding up to a net present value (NPV) of $44.40 million and an ROI of 358%.
might experience benefits of over three years versus costs of , adding up to an NPV of and an ROI of 0%.
Key Statistics
-

Return on investment (ROI)
359%359%
-

Benefits PV
$56.8M$56.8M
-

Net present value (NPV)
$44.4M$44.4M
-

Payback
<6 months<6 months
Benefits (Three-Year)
Cost savings from eliminated tool sprawl and maintenance Labor savings from incident prevention and accelerated MTTR Avoided revenue loss from outage prevention Internal resource efficiency and productivity savingsTEI Framework And Methodology
From the information provided in the interviews, Forrester constructed a Total Economic Impact™ framework for those organizations considering an investment in a Cisco Full-Stack Observability solution.
The objective of the framework is to identify the cost, benefit, flexibility, and risk factors that affect the investment decision. Forrester took a multistep approach to evaluate the impact that Cisco Full-Stack Observability can have on an organization.
-
Due Diligence
Interviewed Cisco stakeholders and Forrester analysts to gather data relative to the Cisco Full-Stack Observability portfolio.
-
Interviews
Interviewed four representatives at organizations using Cisco Full-Stack Observability to obtain data about costs, benefits, and risks.
-
Composite Organization
Designed a composite organization based on characteristics of the interviewees’ organizations.
-
Financial Model Framework
Constructed a financial model representative of the interviews using the TEI methodology and risk-adjusted the financial model based on issues and concerns of the interviewees.
-
Case Study
Employed four fundamental elements of TEI in modeling the investment impact: benefits, costs, flexibility, and risks. Given the increasing sophistication of ROI analyses related to IT investments, Forrester’s TEI methodology provides a complete picture of the total economic impact of purchase decisions. Please see Appendix A for additional information on the TEI methodology.
Disclosures
Readers should be aware of the following:
This study is commissioned by Cisco and delivered by Forrester Consulting. It is not meant to be used as a competitive analysis.
Forrester makes no assumptions as to the potential ROI that other organizations will receive. Forrester strongly advises that readers use their own estimates within the framework provided in the study to determine the appropriateness of an investment in a Cisco Full-Stack Observability solution. For the interactive functionality using Configure Data/Custom Data, the intent is for the questions to solicit inputs specific to a prospect's business. Forrester believes that this analysis is representative of what companies may achieve with Full-Stack Observability based on the inputs provided and any assumptions made. Forrester does not endorse Cisco or its offerings. Although great care has been taken to ensure the accuracy and completeness of this model, Cisco and Forrester Research are unable to accept any legal responsibility for any actions taken on the basis of the information contained herein. The interactive tool is provided ‘AS IS,’ and Forrester and Cisco make no warranties of any kind.
Cisco reviewed and provided feedback to Forrester, but Forrester maintains editorial control over the study and its findings and does not accept changes to the study that contradict Forrester’s findings or obscure the meaning of the study.
Cisco provided the customer names for the interviews but did not participate in the interviews.
Consulting Team:
Stephanie Slate
Drivers leading to the Cisco Full-Stack Observability investment
Interviews
| Role | Industry | Revenue | Number of employees |
|---|---|---|---|
| Manager of application performance | Retail | $1B | 5,500 |
| Program manager | Government administration | $21B | 35,000 |
| Director of infrastructure and operations | Hospitality | $14B | 85,000 |
| VP of enterprise command center | Financial services | $2.2B | 5,520 |
Key Challenges
While the internet existed long before the COVID-19 pandemic, the crisis solidified the shift for even the most hesitant of consumers to use the internet and trust it for all their needs. Now, the constant expectation for seamless digital experiences has amplified the need for providers to swiftly respond to operational disruptions. If brands cannot meet customers’ demands, these disruptions not only mean operational losses and brand damage, but also potential concerns for public health and safety.3 As more companies push technology to their limit, failure is more complex to understand and troubleshoot as teams try to make sense of the technology and the collective understanding for which employees are needed for triage and resolution.
Interviewees said the high volume of system issues and outages without the proper visibility had a detrimental impact on business continuity at their organizations, which caused teams to work in an unstructured reactive state instead of a proactive stable IT environment.
The interviewees noted how their organizations struggled with common challenges, including:
-
Siloed people, processes, and technology. The various IT infrastructures within the interviewees’ organizations were becoming more complex; some were in the process of transitioning from on-premises to cloud environments while others were expanding their business operations with more intricate IT use cases. Unfortunately, the growth of infrastructure and applications occurred without comprehensive planning, which resulted in the creation of silos within the organizations. Teams were not effectively communicating internally or across functions, and the organizations implemented solutions from different vendors without an overarching strategic plan.
A VP of enterprise command center at a financial services organization described their company’s situation: “Our infrastructure was outdated. We needed an initiative to consolidate and modernize our processes and applications. Migrations were taking place from outdated legacy data centers to new ones. The presence of numerous silos was a challenge, and our goal was to eliminate those silos and bridge the gap.” -
Inefficient war-room processes to identify and resolve issues and outages. Due to the absence or fragmentation of observability tools, the interviewees’ organizations faced significant challenges in identifying the causes of issues or outages. The program manager of a government administration organization shared that it could take “hours or even days” to track something down and that this often led to a culture of finger-pointing within the organization.
The director of infrastructure and operations at a hospitality organization highlighted: “Typically, everyone blames the network. Then, if [that’s not to blame,] it’s the firewalls. And if it wasn’t those two things, then you’ve got teams pointing fingers at each other."
The process of resolving issues or outages was also highly inefficient. The VP of enterprise command center at the financial services organization said: “War rooms and consolidations were common. Team A wasn't communicating with Team B, which was one of the main reasons we needed a command center. Without it, these silos and separate conversations would persist.” -
Too many issues and outages that negatively impacted business revenue. For online businesses, any disruption in infrastructure or network directly translates to business and revenue loss. The interviewees said their organizations experienced significant challenges because they lacked effective tools to prevent issues and analyze their root causes. Consequently, the organizations suffered from both revenue loss and damage to their brand reputations.
The manager of application performance at a retail organization expressed the impact by stating: “The revenue loss is evident if our distribution center is unable to ship or if we encounter issues in the cloud. Additionally, there is the concern of brand reputation. To give you an estimate, if our distribution center experiences downtime, it can cost us approximately $1 million in revenue per hour.”
Investment Objectives
The interviewees’ organizations searched for a solution that could:
- Provide visibility into revenue losses.
- Fix things quickly with limited impact on brand reputation and customer satisfaction.
- Close silos and consolidate tools.
After a request for proposal (RFP) and business case process evaluating multiple vendors, the interviewees’ organizations chose the Cisco Full-Stack Observability portfolio and began deployment. Each organization deployed ThousandEyes and AppDynamics together to gain the full stack observability into infrastructure and applications. And they took multiple steps to implement the services. During the POC stage, a small percentage of the infrastructure and applications integrated with the AppDynamics component of the Cisco FSO solution. Full integration followed in years 2 and 3.
Composite Organization
Based on the interviews, Forrester constructed a TEI framework, a composite company, and an ROI analysis that illustrates the areas financially affected. The composite organization is representative of the four interviewees, and it is used to present the aggregate financial analysis in the next section. The composite organization has the following characteristics:
Description of composite. The composite is a global, multibillion-dollar retail organization that provides sales, customer support, and service/warranty support for its consumer products in high volume. The organization has a strong brand, a large customer base, and a strong online and offline presence. It has 50,000 employees, a hybrid IT infrastructure, and generates annual revenue of $20 billion. As a result of the COVID-19 pandemic, more of the composite’s customers rely on the organization’s digital experiences to interact with the brand. As a result, the composite has undertaken a digital transformation to improve the experiences of internal users and customers because they are often the ones who alert the organization when there are issues with the website. Executive leadership demands more visibility into the environment to ensure that all systems are running smoothly and that teams are working as efficiently and productively as possible.
Deployment characteristics. The composite organization opts to complete a proof of concept on AppDynamics and installs five critical applications onto the solution. With the plan to have 125 applications total, it rolls out the applications in phases: 31 applications by the end of in Year 1, 63 by the end of Year 2, and 125 by the end of Year 3. The composite organization prioritizes fully deploying ThousandEyes in Year 1 and covers the full infrastructure during the implementation phase. The goal is to ensure optimal productivity for noncustomer-facing employees.
Quantified benefit data as applied to the composite
Total Benefits
| Ref. | Benefit | Year 1 | Year 2 | Year 3 | Total | Present Value |
|---|---|---|---|---|---|---|
| Atr | Cost savings from eliminated tool sprawl and maintenance | $6,630,000 $6,630,000 | $7,956,000 $7,956,000 | $8,840,000 $8,840,000 | $23,426,000 $23,426,000 | $19,244,102 $19,244,102 |
| Btr | Labor savings from incident prevention and accelerated MTTR | $2,465,190 $2,465,190 | $5,035,928 $5,035,928 | $10,021,883 $10,021,883 | $17,523,000 $17,523,000 | $13,932,594 $13,932,594 |
| Ctr | Avoided revenue loss from outage prevention | $5,190,324 $5,190,324 | $9,308,733 $9,308,733 | $13,539,975 $13,539,975 | $28,039,032 $28,039,032 | $22,584,428 $22,584,428 |
| Dtr | Internal resource efficiency and productivity savings | $350,280 $350,280 | $437,850 $437,850 | $525,420 $525,420 | $1,313,550 $1,313,550 | $1,075,052 $1,075,052 |
| Total benefits (risk-adjusted) | $14,635,794 $14,635,794 | $22,738,510 $22,738,510 | $32,927,278 $32,927,278 | $70,301,582 $70,301,582 | $56,836,176 $56,836,176 | |
Cost Savings From Eliminated Tool Sprawl And Maintenance
Evidence and data. Among the four interviewees, three said their organization relied on legacy tools to monitor its infrastructure and applications. These applications were not functioning properly and, as solutions migrated to the cloud, the organizations lost the visibility they once had on-premises. In light of this, the mix of legacy, cloud, on-premises, and hybrid meant that teams struggled to get a handle on things, which seemed unsustainable. With the implementation of Cisco FSO, the interviewees’ organizations consolidated their disparate legacy systems and eliminated technical debt in their environments.
- In their hybrid IT environment, the interviewees’ organizations had deployed a variety of legacy tools to monitor their on-premises and cloud infrastructures separately. However, as they began migrating to the cloud, they encountered visibility challenges and could not determine the right course of action. The manager of application performance at a retail organization said the majority of their company’s monitoring solutions were focused on the on-premises infrastructure, which resulted in a loss of direct visibility. They shared: “As we went to the cloud and we started losing direct visibility on some of our state … we were on-prem with SAP ECC, and now we are SAP HANA running on infrastructure in Azure. There are places where we can’t see things. This is why it takes so long to figure out when there’s slowness or intermittent issues.”
- Interviewees shared that by using siloed tools, their organizations faced limited visibility into their systems, and their internal teams wasted valuable effort maintaining multiple solutions. Teams struggled to gain insights from the alerts they received. A director of infrastructure and operations at a hospitality organization illustrated this point: “There’s operational cost savings and improved efficiencies. We are no longer trying to maintain 28 separate monitoring applications. We were able to retire 22 legacy tools. We also gained operational efficiencies because, with Cisco FSO, we no longer have data silos. We can now correlate the data through the tech stack. We have moved from troubleshooting siloed errors to being able to correlate the errors.”
- Interviewees said that replacing legacy solutions brought immediate benefits. The manager of application performance at a retail organization shared the following advice to organizations interested in Cisco FSO: “Don’t underestimate the complexity of trying to get a full, true, end-to-end view of things. Pick a couple of use cases that are important, and it will show a lot of value of what the tool is. You get some quick wins, [and those wins] continually drive more value. Celebrate the value that you get from driving down [the technical debt and complexity].”
Modeling and assumptions. Based on the interviews, Forrester assumes the following about the composite organization:
- The composite organization previously had 30 monitoring tools in place to provide visibility into both on-premises and cloud infrastructure. Meanwhile, it deployed certain tools to monitor the performance of the applications.
has 0 legacy tools for monitoring IT infrastructure and applications.
- With the implementation of Cisco FSO, the composite retires 50% of its legacy tools (15 tools) in Year 1. After seeing further duplications and tool redundancies, this percentage increases to 60% (to 18 tools) in Year 2, and to 65% in Year 3. This leaves the composite with 10 remaining legacy tools.
might retire 0 tools in Year 1, 0 more tools in Year 2 (totaling 0 tools retired), and 0 more tools in Year 3 (totaling 0 tools retired.
- The average annual licensing cost per legacy tool is $500,000. The composite organization spends another $20,000 on maintenance costs per tool.
For , the average annual licensing cost per tool is $0. might spend another $0 on maintenance for each tool.
Risks. Forrester recognizes that these results may not be representative of all experiences and that the benefit will vary among organizations depending on the following factors:
- The size of the organization and the infrastructure environment, which will impact the number of legacy tools.
- Whether or not the organization is willing to depart with legacy tools. Through personal preferences and workplace politics, the adoption level of Cisco FSO across the organization may change the percentage of tools retired as teams adopt the functionality from the Cisco tools and realize they might be able to retire additional tools.
- The maturity of the organization’s internal IT team, which will change the maintenance effort.
Results. To account for these risks, Forrester adjusted this benefit downward by 15%, yielding a three-year, risk-adjusted total PV (discounted at 10%) of $19.2 million.
For , this benefit might have a three-year, risk-adjusted PV of .
Cost Savings From Eliminated Tool Sprawl And Maintenance
| Ref. | Metric | Source | Year 1 | Year 2 | Year 3 | |
|---|---|---|---|---|---|---|
| A1 | Tools to observe, monitor, operate, etc. in prior environment | CompositeComposite | 3030 | 3030 | 3030 | |
| A2 | Percentage consolidation of tools with Cisco FSO | InterviewsInterviews | 50%50% | 60%60% | 65%65% | |
| A3 | Avoided duplicative observe, operate, and monitor applications (tool sprawl) with Cisco FSO (rounded) | A1*A2 | 1515 | 1818 | 2020 | |
| A4 | Average annual licensing cost per observe, monitor, operate, etc. applications | CompositeComposite | $500,000 $500,000 | $500,000 $500,000 | $500,000 $500,000 | |
| A5 | Subtotal: Tool-sprawl licensing avoided with Cisco FSO | A3*A4 | $7,500,000 $7,500,000 | $9,000,000 $9,000,000 | $10,000,000 $10,000,000 | |
| A6 | Average infrastructure and maintenance cost per application | CompositeComposite | $20,000 $20,000 | $20,000 $20,000 | $20,000 $20,000 | |
| A7 | Subtotal: Infrastructure savings from eliminated tools with Cisco FSO | A3*A6 | $300,000 $300,000 | $360,000 $360,000 | $400,000 $400,000 | |
| At | Cost savings from eliminated tool sprawl and maintenance | A5+A7 | $7,800,000 $7,800,000 | $9,360,000 $9,360,000 | $10,400,000 $10,400,000 | |
| Risk adjustment | ↓15% | |||||
| Atr | Cost savings from eliminated tool sprawl and maintenance (risk-adjusted) | $6,630,000 $6,630,000 | $7,956,000 $7,956,000 | $8,840,000 $8,840,000 | ||
| Three-year total: $23,426,000 $23,426,000 | Three-year present value: $19,244,102 $19,244,102 | |||||
Labor Savings From Incident Prevention And Accelerated MTTR
Evidence and data. Regardless of their organization’s industry and size, each of the interviewees said their company significantly reduced outages and MTTR following the implementation of Cisco FSO.
- Interviewees said that prior to implementing AppDynamics, their organizations experienced frequent production issues and false-positive alerts. Because of this, they hosted war-room sessions that descended into finger-pointing. A VP of enterprise command center at a financial services firm illustrated the high tensions and political lines their organization experienced: “[Before using Cisco FSO,] we were operating in silos. Team A wasn’t talking to Team B. This is one of the bigger reasons that we wanted [Cisco FSO] in the command center. We knew that the separate conversations would continue otherwise.”
-
Interviewees said Cisco FSO offers comprehensive visibility into the entire IT infrastructure stack that encompasses applications and networks. ThousandEyes utilizes strategically positioned data collection points across the globe to monitor network traffic, analyze performance metrics, and proactively identify potential issues. Meanwhile, AppDynamics focuses on monitoring various aspects of applications, such as code-level performance, transaction tracing, user-experience monitoring, and infrastructure dependencies. Interviewees said it excels in automatically detecting and diagnosing performance issues for swift resolution.
The director of infrastructure and operations at a hospitality company shared: “When we added AppDynamics, it gave us a lot of things. Most importantly, we gained visibility at the application level and not just at the infrastructure level. As the Cisco FSO solution matures, we’re getting even better correlation through the tech stack. We are looking forward to moving more of our applications into the platform.” -
With the deployment of both ThousandEyes and AppDynamics, interviewees’ organizations started to see positive results in various dimensions:
- The program manager in government administration said their organization experienced a 60% to 70% decrease in IT tickets and that the MTTR decreased from 16 hours to 15 to 20 minutes.
- The director of infrastructure and operations at a hospitality organization said their company reduced its MTTR by 50%: “Our target mean time to resolution started at 4 hours for critical. We were able to reduce that to 2 hours.”
- The manager of application performance at a retail organization said fewer people are now involved in the resolution process: “I would say we’ve seen improvement in the reduction of the number of people we have to bring into calls because we can isolate the trouble faster now. … You’re not calling 15 people at night. If there is a problem, [you’re] just calling two or three people who are going to fix it.”
- The director of infrastructure and operations at a hospitality company said: “[Before, each call had] 30 people minimum. It would be one from each engineering team and infrastructure plus leadership. … [Now,] … I would say 10 people is typical.”
- Interviewees said that with Cisco FSO, the process of resolving issues or outages was refined and that fewer people are needed on a call or in the war room. The director of infrastructure and operations in hospitality said: “We paired our alerting with our event management platform. This gave people throughout the organization visibility to the incident and progress. With the increased visibility, people didn’t have to be on the call anymore just to hear updates. Business stakeholders’ confidence also grew as we reduced the number of incidents. The AppDynamics platform has moved us from a reactive state to proactive state.”
Modeling and assumptions. Based on the interviews, Forrester assumes the following about the composite organization:
- The composite organization runs 125 business-critical applications in total, and it rolls out the applications onto AppDynamics in phases: 25% (31 applications) by the end of in Year 1, 50% (63 total) by the end of Year 2, and 100% (125) by the end of Year 3. Previously, each application would have six incidents per year. With the deployment of Cisco FSO, the number of incidents declines by 50%.
has 0 business-critical applications in total. By the end of Year 1, 0 applications might be on AppDynamics. By the end of Year 2, 0 applications might be on AppDynamics. And by the end of Year 3, 0 applications might be on AppDynamics. On average, each application has 0 incidents per year.
- Before the implementation of Cisco FSO, resolving an application required a team of 31 staff engineers, three managers, and two executives working in the war room. With the implementation, the number of engineers decreases by 80%, and the time they spend in the war room decreases by 90%.
Without Cisco FSO, resolving an incident at involves 0 staff engineers and might involve 0 managers and 0 executives.
- After the deployment of Cisco FSO, only one manager is needed in the war room, and executive leadership’s presence is only necessary in Year 1. The time leaders spend in the war room decreases year by year.
With Cisco FSO, resolving an incident at might involve only 0 manager(s).
- The average fully burdened hourly rate for a triage staff engineer is $78.
- The average fully burdened hourly rate for a manager is $94.
- The average fully burdened hourly rate for an executive leader is $136.
Risks. Forrester recognizes that these results may not be representative of all experiences and that the benefit will vary among organizations depending on the following factors:
- The scale of the Cisco FSO deployment. If an organization only deploys Cisco FSO in a portion of its environments, the reduction in MTTR may be less.
- Whether or not all internal teams adopt Cisco FSO solution components. Different organizations have staggered deployment schedules. A full deployment may take additional time, and it will take longer to realize the full benefit.
- The number of employees needed and their respective roles and salaries.
- The workflow of outage identification and resolution in the previous environment.
Results. To account for these risks, Forrester adjusted this benefit downward by 15%, yielding a three-year, risk-adjusted total PV (discounted at 10%) of $13.9 million.
For , this benefit might have a three-year, risk-adjusted PV of .
Labor Savings From Incident Prevention And Accelerated MTTR
| Ref. | Metric | Source | Year 1 | Year 2 | Year 3 | |
|---|---|---|---|---|---|---|
| B1 | Critical, Tier 1, and Tier 2 applications | CompositeComposite | 125125 | 125125 | 125125 | |
| B2 | Percent of total applications implemented on Cisco FSO | CompositeComposite | 25%25% | 50%50% | 100%100% | |
| B3 | Critical, Tier 1, and Tier 2 applications migrated to Cisco FSO (rounded) | B1*B2 | 3131 | 6363 | 125125 | |
| B4 | Average application performance incidents per application production environment | CompositeComposite | 66 | 66 | 66 | |
| B5 | Staff members actively involved with triage and resolution for critical systems in the prior environment (rounded) | B1*25%B1*25% | 3131 | 3131 | 3131 | |
| B6 | Time spent by staff per incident resolution in the prior environment (hours) | InterviewsInterviews | 66 | 66 | 66 | |
| B7 | Average fully burdened hourly rate for a triage staff member | TEI standardTEI standard | $78 $78 | $78 $78 | $78 $78 | |
| B8 | Managers actively involved with triage and resolution in the prior environment (rounded) | B5*10% | 33 | 33 | 33 | |
| B9 | Time spent by managers per incident resolution in the prior environment (hours) | InterviewsInterviews | 44 | 44 | 44 | |
| B10 | Average fully burdened hourly rate for a manager | CompositeComposite | $94 $94 | $94 $94 | $94 $94 | |
| B11 | Executive leaders actively involved with triage and resolution in the prior environment | CompositeComposite | 22 | 22 | 22 | |
| B12 | Time spent by leadership per incident resolution in the prior environment (hours) | InterviewsInterviews | 11 | 11 | 11 | |
| B13 | Average fully burdened hourly rate for an executive leader | TEI standardTEI standard | $136 $136 | $136 $136 | $136 $136 | |
| B14 | Subtotal: IT operations and leadership labor costs in the prior environment | B3*B4*((B5*B6*B7)+(B8*B9*B10)+(B11*B12*B13)) | $2,958,888 $2,958,888 | $6,013,224 $6,013,224 | $11,931,000 $11,931,000 | |
| B15 | Applications implemented with Cisco FSO (rounded) | B3 | 3131 | 6363 | 125125 | |
| B16 | Issues per application with Cisco FSO accounting for a reduction in production issues and false positives | B4*(100%-50%) | 33 | 33 | 33 | |
| B17 | Staff members involved with triage and resolution with Cisco FSO solutions (rounded) | B5*(100%-80%) | 66 | 66 | 66 | |
| B18 | Time spent by staff for triage and resolution per incident with Cisco FSO solutions (hours) | B6*(100%-90%) | 0.60.6 | 0.60.6 | 0.60.6 | |
| B19 | Managers needed for triage and resolution per incident with Cisco FSO solutions (rounded) | InterviewsInterviews | 11 | 11 | 11 | |
| B20 | Time spent by managers for triage per incident with Cisco FSO solutions (hours) | Y1: B9*(100%-25%); Y2: B9*(100%-50%); Y3: B9*(100%-75%) | 3.03.0 | 2.02.0 | 1.01.0 | |
| B21 | Executive leaders needed for triage and resolution with Cisco FSO solutions (rounded) | InterviewsInterviews | 11 | 00 | 00 | |
| B22 | Time spent by executive leaders on triage and resolution with Cisco FSO solutions (hours) (rounded) | Y1: B12*(100%-50%); Y2: B12*(100%-100%); Y3: B12*(100%-100%) | 0.50.5 | 0.00.0 | 0.00.0 | |
| B23 | Subtotal: IT operations and leadership labor for triage as Cisco FSO Solutions are deployed | B13*B14*((B15*B16*B5)+(B17*B18*B8)+(B19*B20*B11)) | $58,664 $58,664 | $88,603 $88,603 | $140,550 $140,550 | |
| Bt | Labor savings from incident prevention and accelerated MTTR | B14-B23 | $2,900,224 $2,900,224 | $5,924,621 $5,924,621 | $11,790,450 $11,790,450 | |
| Risk adjustment | ↓15% | |||||
| Btr | Labor savings from incident prevention and accelerated MTTR (risk-adjusted) | $2,465,190 $2,465,190 | $5,035,928 $5,035,928 | $10,021,883 $10,021,883 | ||
| Three-year total: $17,523,000 $17,523,000 | Three-year present value: $13,932,594 $13,932,594 | |||||
Avoided Revenue Loss From Outage Prevention
Evidence and data. Interviewees said that as a result of implementing Cisco FSO, their organizations saw a decrease in the number of major outages, and that improved the reliability of their systems and services. This significant improvement had a direct impact on revenue generation and other key business outcomes.
- Interviewees said that as their organizations continued to develop an increasing number of business-critical applications, the potential for outages became a significant concern. The potential negative impacts of such outages on business continuity and revenue was a pressing issue that needed to be addressed. The manager of application performance at the retail organization shared: “If the website is down, we have a revenue delay, or it’s lost if our distribution [team] can’t ship. We need to get the right team on the issue so we don’t take a hit.”
- By leveraging AppDynamics, interviewees’ businesses were able to prioritize issues based on their impact on critical business metrics. This data-driven approach empowered them to make informed decisions aimed at optimizing application performance and enhancing the overall user experience. The VP of enterprise command center at the financial services organization shared: “The [Cisco FSO] environment is primarily focusing on the Tier 1 applications as what we’re looking to anything that’s critical to revenue-generating applications that would impact the organization at any given time. If those are having end-user issues, latency issues, or poor performance, that’s what we’re focusing on with AppDynamics.”
- For businesses with an online presence, outages have a direct impact on revenue loss. The director of infrastructure and operations at a hospitality organization revealed that one hour of downtime would result in a significant $225,000 loss in revenue. Similarly, manager of application performance at the retail organization said that just one hour of downtime translates to a staggering loss of $1 million in revenues. They said: “In order to reduce incidents and impact to the business when you have an outage, you need to be able to get the right information to the right people at the right time. And that’s exactly what Cisco FSO does.”
- Interviewees said that due to its real-time monitoring capabilities, Cisco FSO plays a crucial role in minimizing downtime and optimizing resource utilization. Their organizations witnessed significant decreases in outages following the successful implementation of Cisco FSO. This showcases the effectiveness of the solution in enhancing system stability and improving overall operational efficiency. The manager of application performance at the retail organization mentioned: “[We previously experienced] two to three [outages per] month, and then post-visibility, we probably cut that in half. [Before,] when we had a major outage that could impact revenue, it was every other month. Now, maybe [we see a major outage] every four months.”
Modeling and assumptions. Based on the interviews, Forrester assumes the following about the composite organization:
- Ten percent of the composite organization’s applications directly drive revenue. Before implementation, the organization experienced an average of six outages per application per year. Each outage lasted 4 hours and resulted in downtime.
Without Cisco FSO, has 0 outages per business-critical application per year, with each outage lasting for 0 hours.
- The composite organization has revenue of $20 billion. When an outage occurs, an average of 10% of the revenue is impacted.
has in annual revenue.
- The composite’s operating margin is 29.67%.4
- With the deployment of Cisco FSO, the number of outages reduces by 13% in Year 1, by 25% in Year 2, and by 50% and Year 3. The length of outages reduces by 20% in Year 1, by 40% in Year 2, and by 60% in Year 3.
Risks. Forrester recognizes that these results may not be representative of all experiences and that the benefit will vary among organizations depending on the following factors:
- The complexity of the organization’s business infrastructure and its business-critical applications environment.
- The processes previously used to manage outages, which may vary by the organization’s industry and size. A larger organization may have more complex outage procedures and war-room settings, and this can impact the rate at which it may realize this benefit.
- The amount of revenue that’s impacted when an outage occurs. Different industries have different peak seasons, and if an outage occurs during those times, a greater percentage of revenue will be impacted.
- The company’s operating margin.
Results. To account for these risks, Forrester adjusted this benefit downward by 20%, yielding a three-year, risk-adjusted total PV (discounted at 10%) of $22.5 million.
For , this benefit might have a three-year, risk-adjusted PV of .
Avoided Revenue Loss From Outage Prevention
| Ref. | Metric | Source | Year 1 | Year 2 | Year 3 | |
|---|---|---|---|---|---|---|
| C1 | Applications that directly drive revenue | B1*10%B1*10% | 1313 | 1313 | 1313 | |
| C2 | Major outages in the prior environment | CompositeComposite | 66 | 66 | 66 | |
| C3 | Average outage time in prior environment (hours) | InterviewsInterviews | 44 | 44 | 44 | |
| C4 | Annual revenue | CompositeComposite | $20,000,000,000 $20,000,000,000 | $20,000,000,000 $20,000,000,000 | $20,000,000,000 $20,000,000,000 | |
| C5 | Percentage of revenue affected by a major outage | CompositeComposite | 10%10% | 10%10% | 10%10% | |
| C6 | Average revenue lost per hour during an outage (rounded) | C4*C5/8,760 hours | $228,311 $228,311 | $228,311 $228,311 | $228,311 $228,311 | |
| C7 | Operating profit margin | CompositeComposite | 29.7%29.7% | 29.7%29.7% | 29.7%29.7% | |
| C8 | Subtotal: Revenue lost in prior environment due to outages | C1*C2*C3*C6*C7 | $21,156,211 $21,156,211 | $21,156,211 $21,156,211 | $21,156,211 $21,156,211 | |
| C9 | Reduction in the likelihood of an outage due Cisco FSO | InterviewsInterviews | 13%13% | 25%25% | 50%50% | |
| C10 | Outages with Cisco FSO | C2*(100%-C9) | 5.25.2 | 4.54.5 | 3.03.0 | |
| C11 | Reduction in average length of outages due to Cisco FSO | InterviewsInterviews | 20%20% | 40%40% | 60%60% | |
| C12 | Average outage time with Cisco FSO (hours) | C3*(100%-C11) | 3.23.2 | 2.42.4 | 1.61.6 | |
| C13 | Subtotal: Revenue lost due to outages with Cisco FSO | C1*C10*C12*C6*C7 | $14,668,306 $14,668,306 | $9,520,295 $9,520,295 | $4,231,242 $4,231,242 | |
| Ct | Avoided revenue loss from outage prevention | C8-C13 | $6,487,905 $6,487,905 | $11,635,916 $11,635,916 | $16,924,969 $16,924,969 | |
| Risk adjustment | ↓20% | |||||
| Ctr | Avoided revenue loss from outage prevention (risk-adjusted) | $5,190,324 $5,190,324 | $9,308,733 $9,308,733 | $13,539,975 $13,539,975 | ||
| Three-year total: $28,039,032 $28,039,032 | Three-year present value: $22,584,428 $22,584,428 | |||||
Internal Resource Efficiency And Productivity Savings
Evidence and data. Several interviewees offered high praise for Cisco’s training program, and they emphasized that it offers immense value. These individuals recognized that the program not only sharpened their own expertise in utilizing Cisco FSO, but that it also had a broader impact on their skill sets as internal IT and DevOps employees. The comprehensive nature of the training allowed them to enhance their overall abilities and stay updated with industry best practices.
One key advantage mentioned was the accessibility to Cisco University, which interviewees said offers a wealth of advanced learning materials. Through this platform, team members have the opportunity to delve into specialized topics, explore in-depth technical resources, and gain valuable insights from industry experts. This access to a vast array of educational resources greatly contributed to their professional growth and development.
The impact of the training program on the efficiency and productivity of teams was noteworthy. Interviewees said that by acquiring new knowledge and refining existing skills, team members were able to perform their tasks more effectively and deliver higher-quality results. The shared language and understanding fostered by the training program and Cisco FSO’s user-friendly dashboard further facilitated collaboration among team members with diverse backgrounds and roles. As a result, communication barriers were reduced, which led to smoother workflows and quicker problem resolution.
Modeling and assumptions. Based on the interviews, Forrester assumes the following about the composite organization:
- Fourteen employees (system administrators, database managers, engineers, and DevOps workers) take part in the composite’s implementation of both AppDynamics and ThousandEyes. These employees are certified by Cisco and have access to Cisco University.
might have 0 employees who take part in the implementation of AppDynamics and ThousandEyes.
- By taking the training programs and leveraging the learning resources, the capacity of the internal staff increases by 20% in Year 1, by 25% in Year 2, and by 30% in Year 3.
Risks. Forrester recognizes that these results may not be representative of all experiences and that the benefit will vary among organizations depending on the following factors:
- The number of internal staff members who are certified by Cisco and their enthusiasm about continuously learning.
- The organization’s deployment of Cisco solutions.
Results. To account for these risks, Forrester adjusted this benefit downward by 10%, yielding a three-year, risk-adjusted total PV (discounted at 10%) of $1.1 million.
For , this benefit might have a three-year, risk-adjusted PV of .
Internal Resource Efficiency And Productivity Savings
| Ref. | Metric | Source | Year 1 | Year 2 | Year 3 |
|---|---|---|---|---|---|
| D1 | Internal implementation resources who become certified with Cisco | F1+G2 | 1414 | 1414 | 1414 |
| D2 | Capacity of resources in the prior environment | CompositeComposite | 100%100% | 100%100% | 100%100% |
| D3 | Capacity of resources after becoming certified | InterviewsInterviews | 120%120% | 125%125% | 130%130% |
| D4 | Average fully burdened salary for an internal implementation resource | TEI standardTEI standard | $139,000 $139,000 | $139,000 $139,000 | $139,000 $139,000 |
| Dt | Internal resource efficiency and productivity savings | D1*(D3-D2)*D4 | $389,200 $389,200 | $486,500 $486,500 | $583,800 $583,800 |
| Risk adjustment | ↓10% | ||||
| Dtr | Internal resource efficiency and productivity savings (risk-adjusted) | $350,280 $350,280 | $437,850 $437,850 | $525,420 $525,420 | |
| Three-year total: $1,313,550 $1,313,550 | Three-year present value: $1,075,052 $1,075,052 | ||||
Unquantified Benefits
Interviewees mentioned the following additional benefits that their organizations experienced but were not able to quantify:
- Improved employee experience. Interviewees said Cisco FSO revolutionized their organizations by offering real-time and comprehensive insights across the entire IT environment. This unified view of the IT stack combined with automated monitoring capabilities significantly improved operational efficiency. The IT teams were able to reduce the time spent on manual monitoring and troubleshooting, which enabled them to dedicate more resources to strategic initiatives and innovation. As a result, the organizations experienced higher retention rates, indicating the positive impact of Cisco FSO on customer satisfaction and loyalty.
- Enhanced brand reputation. The reduction in outages significantly improved customer experience for the interviewees’ organizations. The manager of application performance at a retail organization said that prior to implementing Cisco FSO, their company would only become aware of system issues when customers reported outages. With the deployment of Cisco FSO, the organization experienced a notable decrease in the number of reported issues from customers, which led to an enhanced overall customer experience. The interviewee shared: “We’re still getting customers reporting issues, but it’s no longer before we see an alert. It’s happening at the same time as we’re getting the alert. We know what’s happening on our website in probably a matter of minutes, and we now get an alert before the customers even report it.”
- Transformed to a proactive and preventative state. Cisco FSO incorporates advanced analytics and machine learning capabilities that interviewees said offer valuable intelligent insights into system behavior and historical performance trends. These insights empowered IT teams to identify patterns, predict potential issues, and prioritize remediation efforts with greater effectiveness and contextual urgency. By leveraging these capabilities, the organizations gained the ability to proactively prevent issues rather than merely react to them. The director of infrastructure and operations at the hospitality organization shared: “We went from an extremely reactive state [in which] the customer would tell us when our website was down to where we’re definitely proactive and moving to that preventive [state]. … [We want] to get to predictive state.”
-
Solidified departmental alignment and cross-team collaboration. The implementation of Cisco FSO introduced a user-friendly dashboard that greatly improved collaboration among cross-functional teams. This dashboard provided a centralized platform for effective communication and understanding, resulting in significant reductions in war room durations and, in some cases, their elimination altogether. By accessing the same real-time information source and speaking a common language, team members were able to address issues proactively and work more efficiently. The streamlined collaboration not only saved time, but it also increased productivity and customer satisfaction.
The manager of application performance at a retail organization shared: “I will say what has been a benefit is being able to have conversations around quantitative things other than subjective things. We can actually look at the dashboard and look at ThousandEyes and see something quantitative there. It stopped some of that arguing and back and forth or finger-pointing.” - Accelerated cloud transition and expansion of business operations. The implementation of Cisco FSO had a transformative impact on the organizations’ transitions to the cloud. It instilled confidence in their hybrid infrastructures and enabled them to embrace the benefits of cloud computing. This resulted in remarkable improvements in business operations, including enhanced flexibility, scalability, and operational efficiency. The transition also brought about increased agility, collaboration, and cost savings. Overall, the successful implementation of Cisco FSO propelled the organizations’ cloud transitions, leading to significant improvements in business outcomes and positioning them for continued success in the digital landscape.
-
Valued customer partnership with Cisco. According to multiple interviewees, the services provided by Cisco extended beyond simply solving immediate problems. Instead, their organizations formed long-term partnerships with Cisco, which became a crucial factor in their choice of Cisco FSO over alternatives. This partnership approach ensured ongoing support, collaboration, and the ability to address future needs and challenges effectively. The manager of application performance at the retail organization said: “We had a solid existing relationship with Cisco already. Their tools are very capable, and [we know] we’re going to get benefit out of them.”
Cisco also provided assistance to the organizations during the COVID-19 pandemic. The director of infrastructure and operations at the hospitality organization shared: “When we went into [the pandemic], our revenue almost came to a complete stop, but our operations were still up and running. We were still monitoring systems. This was a pivotal moment in our Cisco AppDynamics relationship. The Cisco AppDynamics team proactively reached out to us and said: ‘You know what? I think we can save you some money. Let’s restructure the deals.’ Other companies were only around if they knew there was a revenue opportunity. But the Cisco AppDynamics team showed what it meant to be a partner and not just another vendor. And that went a long way with us.”
Flexibility
The value of flexibility is unique to each customer. There are multiple scenarios in which a customer might implement Cisco Full-Stack Observability and later realize additional uses and business opportunities, including:
-
Integrating more automation tools with Cisco FSO to further free up the internal resources. Two of the interviewees mentioned their organization is planning to implement more automation tools in the future and that they expect to see more benefit delivered by Cisco FSO. The program manager with the government administration organization said: “We’re bringing ServiceNow into the environment. Cisco FSO will climb in ServiceNow, and that will give me even better correlation and data. Everything will be automated — automated and proactive.”
Cisco is also developing AI tools to facilitate the solution. The program manager with the government administration organization mentioned they were implementing Smart Agent for AppDynamics: “That thing is the brains of the operation that will pull down the packages needed for, say, .NET or Java or whatever. So, it’s all automated from that point. That smart agent does the work.” - Utilizing the synergy delivered by Cisco’s acquisition of Splunk. Cisco’s recent acquisition of Splunk brings valuable expertise in the observability space to Cisco FSO users, which can help them enhance their portfolios and customer experiences.5 This presents a significant opportunity for existing Cisco FSO and Splunk users to leverage the collective expertise and capabilities of the combined Cisco portfolio, strengthen their observability practices, and unlock additional benefits.
Flexibility would also be quantified when evaluated as part of a specific project (described in more detail in Appendix A).
Quantified cost data as applied to the composite
Total Costs
| Ref. | Cost | Initial | Year 1 | Year 2 | Year 3 | Total | Present Value |
|---|---|---|---|---|---|---|---|
| Etr | Cisco FSO licensing and hybrid environment costs | $5,500 $5,500 | $3,767,500 $3,767,500 | $3,767,500 $3,767,500 | $3,767,500 $3,767,500 | $11,308,000 $11,308,000 | $9,374,715 $9,374,715 |
| Ftr | Implementation and ongoing management costs for AppDynamics | $101,178 $101,178 | $238,354 $238,354 | $331,309 $331,309 | $544,775 $544,775 | $1,215,616 $1,215,616 | $1,000,970 $1,000,970 |
| Gtr | Implementation and ongoing support costs for ThousandEyes | $52,992 $52,992 | $690,000 $690,000 | $690,000 $690,000 | $690,000 $690,000 | $2,122,992 $2,122,992 | $1,768,920 $1,768,920 |
| Htr | Training costs for Cisco FSO | $150,696 $150,696 | $5,106 $5,106 | $108,146 $108,146 | $5,106 $5,106 | $269,054 $269,054 | $248,551 $248,551 |
| Total costs (risk-adjusted) | $310,366 $310,366 | $4,700,960 $4,700,960 | $4,896,955 $4,896,955 | $5,007,381 $5,007,381 | $14,915,662 $14,915,662 | $12,393,156 $12,393,156 | |
Cisco FSO Licensing And Hybrid Environment Costs
Evidence and data. Interviewees shared that their organizations incurred licensing fees to use Cisco FSO and that the fees were combined with those for AppDynamics and ThousandEyes. Each interviewee’s organization is on a three-year annual plan, and the costs vary by the workloads and the environments of Cisco monitoring. Some of the organizations with complex environments pay professional services fees to Cisco for ongoing support.
Potential licensing costs calculated by this tool are estimates only and do not constitute quotes. For more information, contact Cisco.
Modeling and assumptions. Forrester assumes the following about the composite organization:
- Based on the size of the composite organization, it pays $2.6 million in annual licensing fees for AppDynamics and $420,000 in annual licensing fees for ThousandEyes.
For , the annual licensing fee for AppDynamics might be , and the annual licensing fee for ThousandEyes might be .
- The composite pays ongoing professional services fees for AppDynamics and ThousandEyes of $250,000 and $150,000 per year, respectively.
For , the ongoing professional services fee for AppDynamics might be , and the ongoing professional services fee for ThousandEyes might be .
- With its hybrid infrastructure, the composite pays another $5,000 annually to support cloud applications (e.g., storage and server costs).
might have in additional annual costs.
- Pricing may vary. Contact Cisco for additional details.
Risks. Forrester recognizes that these results may not be representative of all experiences and that the cost will vary among organizations depending on the following factors:
- The growth rate of the business and the level of Cisco FSO usage and adoption.
- The additional annual costs needed to support the organization’s hybrid environments.
- Cisco pricing strategy.
Results. To account for these risks, Forrester adjusted this cost upward by 10%, yielding a three-year, risk-adjusted total PV (discounted at 10%) of $9.4 million.
For , this cost might have a three-year, risk-adjusted PV of .
Cisco FSO Licensing And Hybrid Environment Costs
| Ref. | Metric | Source | Initial | Year 1 | Year 2 | Year 3 | |
|---|---|---|---|---|---|---|---|
| E1 | AppDynamics licensing (3-year annual plan) | CompositeComposite | $2,600,000 $2,600,000 | $2,600,000 $2,600,000 | $2,600,000 $2,600,000 | ||
| E2 | ThousandEyes licensing (3-year annual plan) | CompositeComposite | $420,000 $420,000 | $420,000 $420,000 | $420,000 $420,000 | ||
| E3 | Ongoing professional services for AppDynamics | CompositeComposite | $250,000 $250,000 | $250,000 $250,000 | $250,000 $250,000 | ||
| E4 | Ongoing professional services for ThousandEyes | CompositeComposite | $150,000 $150,000 | $150,000 $150,000 | $150,000 $150,000 | ||
| E5 | Additional annual costs needed to support hybrid application environment requirements (storage, S3, networking, WAN, dedicated servers, etc.) | AssumptionAssumption | $5,000 $5,000 | $5,000 $5,000 | $5,000 $5,000 | $5,000 $5,000 | |
| Et | Cisco FSO licensing and hybrid environment costs | E1+E2+E3+E4+E5 | $5,000 $5,000 | $3,425,000 $3,425,000 | $3,425,000 $3,425,000 | $3,425,000 $3,425,000 | |
| Risk adjustment | ↑10% | ||||||
| Etr | Cisco FSO licensing and hybrid environment costs (risk-adjusted) | $5,500 $5,500 | $3,767,500 $3,767,500 | $3,767,500 $3,767,500 | $3,767,500 $3,767,500 | ||
| Three-year total: $11,308,000 $11,308,000 | Three-year present value: $9,374,715 $9,374,715 | ||||||
Implementation And Ongoing Management Costs For AppDynamics
Evidence and data. The interviewees’ organizations followed a phased approach when implementing AppDynamics, starting with a proof of concept by running a pilot group of applications. Based on the number and business relevance of the applications, the organizations then proceeded to roll out AppDynamics by prioritizing the most critical business applications. This approach ensured a strategic and targeted implementation of AppDynamics across the organizations’ application landscapes.
The program manager with the government administration organization shared: “When I started the implementation, I did this quarterly. We started like a POC got two or three applications back in 2021. In 2022, we kind of scaled up to 20 apps. I brought in 50 the next year, then 190 to 200 business-critical applications.”
Modeling and assumptions. Forrester assumes the following about the composite organization:
- The composite organization assembles a team of six engineers to implement AppDynamics, and they dedicate 180 working hours to the project.
For , 0 internal resource(s) might participate in the implementation of AppDynamics, and each might spend 0 hours on the project.
- The AppDynamics implementation is based on the number of applications. The composite integrates 25% of the applications with AppDynamics in Year 1, 50% in Year 2, and 100% in Year 3.
- The application owners spend 40 hours to implement AppDynamics in the beginning. With experience accumulating, the hours decrease year by year.
For , application owner(s) might spend 0 hours implementing AppDynamics initially, 0 hours in Year 1, 0 hours in Year 2, and 0 hours in Year 3.
- The composite incurs some miscellaneous costs associated with application integration. This cost depends on the number of applications implemented.
- One program manager dedicates 80% of their time to ongoing management of AppDynamics.
For , 0 program manager(s) might dedicate time to AppDynamics.
Risks. Forrester recognizes that these results may not be representative of all experiences and that the cost will vary among organizations depending on the following factors:
- The number of applications and the rollout schedule.
- The level of complexity and desired customization.
- The level of maturity of internal IT staff members and their respective salaries.
Results. To account for these risks, Forrester adjusted this cost upward by 10%, yielding a three-year, risk-adjusted total PV (discounted at 10%) of $1 million.
For , this cost might have a three-year, risk-adjusted PV of .
Implementation And Ongoing Management Costs For AppDynamics
| Ref. | Metric | Source | Initial | Year 1 | Year 2 | Year 3 | |
|---|---|---|---|---|---|---|---|
| F1 | Internal resources who participate in implementation | CompositeComposite | 66 | ||||
| F2 | Time dedicated to implementation tasks (hours) | CompositeComposite | 180180 | ||||
| F3 | Average burdened monthly cost for an implementation resource | CompositeComposite | $66 $66 | ||||
| F4 | Subtotal: Internal implementation labor | F1*F2*F3 | $71,280 $71,280 | $0 $0 | $0 $0 | $0 $0 | |
| F5 | Applications implemented | B3 | 55 | 3131 | 6363 | 125125 | |
| F6 | Incremental applications | F5-F6PY | 55 | 2626 | 3232 | 6262 | |
| F7 | Time spent per additional application integrated and tested (hours) | CompositeComposite | 4040 | 3535 | 3030 | 3030 | |
| F8 | Burdened hourly cost for an application owner | CompositeComposite | $101 $101 | $101 $101 | $101 $101 | $101 $101 | |
| F9 | Subtotal: Additional app integration labor costs | F5*F7*F8 | $20,200 $20,200 | $109,585 $109,585 | $190,890 $190,890 | $378,750 $378,750 | |
| F10 | Miscellaneous API management fees, additional storage fees, and licensing fees | F5*10%*$1,000 | $500 $500 | $3,100 $3,100 | $6,300 $6,300 | $12,500 $12,500 | |
| F11 | Subtotal: Implementation costs for AppDynamics | F4+F9+F10 | $91,980 $91,980 | $112,685 $112,685 | $197,190 $197,190 | $391,250 $391,250 | |
| F12 | System admin/program managers dedicated to ongoing management | CompositeComposite | 11 | 11 | 11 | ||
| F13 | Percentage of time dedicated to upkeep | InterviewsInterviews | 80%80% | 80%80% | 80%80% | ||
| F14 | Average burdened annual cost for a system admin/program manager | CompositeComposite | $130,000 $130,000 | $130,000 $130,000 | $130,000 $130,000 | ||
| F15 | Subtotal: Cost of ongoing management labor | F12*F13*F14 | $104,000 $104,000 | $104,000 $104,000 | $104,000 $104,000 | ||
| Ft | Implementation and ongoing management costs for AppDynamics | F11+F15 | $91,980 $91,980 | $216,685 $216,685 | $301,190 $301,190 | $495,250 $495,250 | |
| Risk adjustment | ↑10% | ||||||
| Ftr | Implementation and ongoing management costs for AppDynamics (risk-adjusted) | $101,178 $101,178 | $238,354 $238,354 | $331,309 $331,309 | $544,775 $544,775 | ||
| Three-year total: $1,215,616 $1,215,616 | Three-year present value: $1,000,970 $1,000,970 | ||||||
Implementation And Ongoing Support Costs For ThousandEyes
Evidence and data. As a common practice, the interviewees’ organizations initially established pilot groups to conduct proofs of concept for ThousandEyes. Based on the results and specific deployment requirements, the organizations then proceeded to roll out ThousandEyes across the entire organization. The timeline for implementation varied depending on the unique needs and considerations of each organization’s deployment process.
The manager of application performance at the retail organization shared: “I would say it took a month for ThousandEyes to get up and running. We also have a separate project engagement with [Cisco] to continue to build out our FSO tools, and that has probably six individuals supporting us: one architect and … five developers/engineers.”
Modeling and assumptions. Forrester assumes the following about the composite organization:
- The composite organization assembles a team of eight engineers to implement ThousandEyes. Each engineer invests 80 hours in the project.
For , 0 employee(s) might participate in the implementation of ThousandEyes, and each might spend 0 hours on the project.
- Four DevOps employees are responsible for the ongoing maintenance of ThousandEyes.
For , 0 employee(s) might be responsible for the ongoing maintenance of ThousandEyes.
- The average annual compensation for a DevOps employee is $150,000.
Risks. Forrester recognizes that these results may not be representative of all experiences and that the cost will vary among organizations depending on the following factors:
- The complexity of the organization’s internal infrastructure.
- The level of customization.
- The relative expertise of the internal IT team members and their respective salaries.
Results. To account for these risks, Forrester adjusted this cost upward by 15%, yielding a three-year, risk-adjusted total PV (discounted at 10%) of $1.8 million.
For , this cost might have a three-year, risk-adjusted PV of .
Implementation And Ongoing Support Costs For ThousandEyes
| Ref. | Metric | Source | Initial | Year 1 | Year 2 | Year 3 | |
|---|---|---|---|---|---|---|---|
| G1 | Time spent on implementation (hours) | CompositeComposite | 8080 | ||||
| G2 | Employees dedicated to deployment | CompositeComposite | 88 | ||||
| G3 | Average fully burdened hourly rate for a DevOps employee | TEI standardTEI standard | $72 $72 | ||||
| G4 | Subtotal: Internal implementation labor | G1*G2*G3 | $46,080 $46,080 | ||||
| G5 | Employees needed for ongoing maintenance | CompositeComposite | 44 | 44 | 44 | ||
| G6 | Fully burdened hourly rate for a DevOps employee | TEI standardTEI standard | $150,000 $150,000 | $150,000 $150,000 | $150,000 $150,000 | ||
| G7 | Subtotal: Internal ongoing maintenance labor | G5*G6 | $0 $0 | $600,000 $600,000 | $600,000 $600,000 | $600,000 $600,000 | |
| Gt | Implementation and ongoing support costs for ThousandEyes | G4+G7 | $46,080 $46,080 | $600,000 $600,000 | $600,000 $600,000 | $600,000 $600,000 | |
| Risk adjustment | ↑15% | ||||||
| Gtr | Implementation and ongoing support costs for ThousandEyes (risk-adjusted) | $52,992 $52,992 | $690,000 $690,000 | $690,000 $690,000 | $690,000 $690,000 | ||
| Three-year total: $2,122,992 $2,122,992 | Three-year present value: $1,768,920 $1,768,920 | ||||||
Training Costs For Cisco FSO
Evidence and data. In addition to IT engineers and DevOps employees, the business owners of the applications actively participated in the daily usage and maintenance of Cisco FSO. The interviewees emphasized that training was an integral part of the internal investment, ensuring that both IT and business teams were well-equipped to effectively utilize and maintain the platform. This collaborative approach fostered a shared responsibility and understanding of the application’s performance and overall success. The program manager at a government administration organization shared: “Last year, I had between 50 and 70 hours’ worth of training. Core application managers took 20 or 40 hours for all the courses.”
Modeling and assumptions. Forrester assumes the following about the composite organization:
- During the implementation, 14 program managers receive intensive training of 40 hours each. For ongoing usage, each application owner (30 function leaders) receives 2 hours of training each year.
For , 0 employee(s) might receive training initially, and then 0 employee(s) might receive training in subsequent years.
- Cisco provides certification training via CiscoU platform to the composite’s IT architects to better utilize the solutions. The platform access fee is $6,000 for two years, and the cost of certification is $400.
Risks. Forrester recognizes that these results may not be representative of all experiences and that the cost will vary among organizations depending on the following factors:
- The organization’s culture of continuous learning.
- The expertise of internal application owners and IT staff.
Results. To account for these risks, Forrester adjusted this cost upward by 15%, yielding a three-year, risk-adjusted total PV (discounted at 10%) of $249,000.
For , this cost might have a three-year, risk-adjusted PV of .
Training Costs For Cisco FSO
| Ref. | Metric | Source | Initial | Year 1 | Year 2 | Year 3 | |
|---|---|---|---|---|---|---|---|
| H1 | Resources who participate in training for Cisco FSO | F1+G2 | 1414 | 3030 | 3030 | 3030 | |
| H2 | Training time (hours) | CompositeComposite | 4040 | 22 | 22 | 22 | |
| H3 | Average fully burdened hourly cost for an end-team member | CompositeComposite | $74 $74 | $74 $74 | $74 $74 | $74 $74 | |
| H4 | Subtotal: End-team training costs | H1*H2*H3 | $41,440 $41,440 | $4,440 $4,440 | $4,440 $4,440 | $4,440 $4,440 | |
| H5 | Tuition for CiscoU All Access | Cisco | $6,000 $6,000 | $0 $0 | $6,000 $6,000 | $0 $0 | |
| H6 | Cost of certification for IT architect | Cisco | $400 $400 | $0 $0 | $400 $400 | $0 $0 | |
| H7 | Subtotal: Tuition and certification costs | H1Y0*(H5+H6) | $89,600 $89,600 | $0 $0 | $89,600 $89,600 | $0 $0 | |
| Ht | Training costs for Cisco FSO | H4+H7 | $131,040 $131,040 | $4,440 $4,440 | $94,040 $94,040 | $4,440 $4,440 | |
| Risk adjustment | ↑15% | ||||||
| Htr | Training costs for Cisco FSO (risk-adjusted) | $150,696 $150,696 | $5,106 $5,106 | $108,146 $108,146 | $5,106 $5,106 | ||
| Three-year total: $269,054 $269,054 | Three-year present value: $248,551 $248,551 | ||||||
Consolidated Three-Year Risk-Adjusted Metrics
Cash Flow Chart (Risk-Adjusted)
Total costs Total benefits Cumulative net benefits-

The financial results calculated in the Benefits and Costs sections can be used to determine the ROI, NPV, and payback period for the composite organization’s investment. Forrester assumes a yearly discount rate of 10% for this analysis.
These risk-adjusted ROI, NPV, and payback period values are determined by applying risk-adjustment factors to the unadjusted results in each Benefit and Cost section.
Cash Flow Analysis (Risk-Adjusted Estimates)
| Initial | Year 1 | Year 2 | Year 3 | Total | Present Value | |
|---|---|---|---|---|---|---|
| Total costs | ($310,366)($310,366) | ($4,700,960)($4,700,960) | ($4,896,955)($4,896,955) | ($5,007,381)($5,007,381) | ($14,915,662)($14,915,662) | ($12,393,156)($12,393,156) |
| Total benefits | $0 $0 | $14,635,794 $14,635,794 | $22,738,510 $22,738,510 | $32,927,278 $32,927,278 | $70,301,582 $70,301,582 | $56,836,176 $56,836,176 |
| Net benefits | ($310,366)($310,366) | $9,934,835 $9,934,835 | $17,841,555 $17,841,555 | $27,919,897 $27,919,897 | $55,385,921 $55,385,921 | $44,443,020 $44,443,020 |
| ROI | 359%359% | |||||
| Payback | <6<6 | |||||
Appendix A: Total Economic Impact
Total Economic Impact is a methodology developed by Forrester Research that enhances a company’s technology decision-making processes and assists vendors in communicating the value proposition of their products and services to clients. The TEI methodology helps companies demonstrate, justify, and realize the tangible value of IT initiatives to both senior management and other key business stakeholders.
Total Economic Impact Approach
-
Benefits represent the value delivered to the business by the product. The TEI methodology places equal weight on the measure of benefits and the measure of costs, allowing for a full examination of the effect of the technology on the entire organization.
-

Costs consider all expenses necessary to deliver the proposed value, or benefits, of the product. The cost category within TEI captures incremental costs over the existing environment for ongoing costs associated with the solution.
-
Flexibility represents the strategic value that can be obtained for some future additional investment building on top of the initial investment already made. Having the ability to capture that benefit has a PV that can be estimated.
-

Risks measure the uncertainty of benefit and cost estimates given: 1) the likelihood that estimates will meet original projections and 2) the likelihood that estimates will be tracked over time. TEI risk factors are based on “triangular distribution.”
The initial investment column contains costs incurred at “time 0” or at the beginning of Year 1 that are not discounted. All other cash flows are discounted using the discount rate at the end of the year. PV calculations are calculated for each total cost and benefit estimate. NPV calculations in the summary tables are the sum of the initial investment and the discounted cash flows in each year. Sums and present value calculations of the Total Benefits, Total Costs, and Cash Flow tables may not exactly add up, as some rounding may occur.
Appendix B: Endnotes
1 Source: The Future Of Cloud, Forrester Research Inc., July 17, 2023.
2 Total Economic Impact is a methodology developed by Forrester Research that enhances a company’s technology decision-making processes and assists vendors in communicating the value proposition of their products and services to clients. The TEI methodology helps companies demonstrate, justify, and realize the tangible value of IT initiatives to both senior management and other key business stakeholders.
3 Source: The Forrester Guide To Incident And Crisis Management, Forrester Research, Inc., May 20, 2022.
4 Source: Margins by sector (US), NYU Stern School of Business, January 2024.
5 Source: Cisco Completes Acquisition of Splunk, Cisco press release, March 18, 2024.