[CONTENT]
$
USD
US Dollar
Total Economic Impact
Cost Savings And Business Benefits Enabled By Braze
A FORRESTER TOTAL ECONOMIC IMPACT STUDY COMMISSIONED BY Braze, APRIL 2026
|
Total Economic Impact The Total Economic Impact™ Of Braze A FORRESTER TOTAL ECONOMIC IMPACT STUDY COMMISSIONED BY Braze, APRIL 2026 Cost Savings And Business Benefits Enabled By Braze 

T
B
M
K
[CONTENT]
[CONTENT]
Executive SummaryToday’s customers trust brands that provide experiences that are contextually relevant and useful to them in their moments of need.1 The more personal the interaction, the more likely a person is to respond. While marketers have long understood this dynamic, they have historically faced a fundamental constraint: Personalization and scale were difficult to achieve at the same time. As a result, many organizations were forced to choose between relevance and reach. Today, AI‑enabled innovations in modern martech platforms have materially changed that equation — making it possible to deliver authentic, individualized experiences at enterprise scale. Braze is a customer engagement platform that allows marketers to create and deploy highly personalized communications to their customers. Its core customer journey platform supports a high volume of experimentation across email, in-app and onsite messaging, mobile and web push notifications, SMS and RCS, app and web banners and inboxes, messaging apps, and landing pages, using a company’s first-party data to target tailored experiences to complex customer segments. It also includes the Braze Data Platform, a comprehensive and composable set of data products and partner integrations, which helps brands unify, activate, and distribute their data to deliver impactful customer engagement on Braze. Braze embeds AI throughout the platform — including BrazeAI Operator and BrazeAI Agent Console — to help marketers gain deeper context, apply smarter intelligence, and deliver more meaningful customer experiences at scale. BrazeAI Decisioning Studio, an advanced AI decisioning product separate from the platform-embedded AI features described above, moves from tailored content to true 1:1 personalization by allowing the marketer to create a content library of next-best-offer and next-best-action variables, specify a KPI goal, and allow the machine learning agent to optimize the campaign continuously toward that goal based on learnings and performance.
Braze commissioned Forrester Consulting to conduct a Total Economic Impact™ (TEI) study and examine the potential return on investment (ROI) enterprises may realize by deploying the core Braze customer engagement platform and BrazeAI Decisioning Studio.2 The purpose of this study is to provide readers with a framework to evaluate the potential financial impact of Braze on their organizations. To better understand the benefits, costs, and risks associated with this investment, Forrester interviewed six decision-makers with an average of 5.3 years of experience using Braze. For the purposes of this study, Forrester aggregated the experiences of the interviewees and combined the results into a single composite organization, which is a midtier subscription-based media company with 6.5 million customers. Interviewees said that prior to moving to Braze, their organizations used legacy marketing solutions that were either clunky to use, limited in scope, or both. After the investment in Braze, the interviewees were able to significantly elevate both the scale (quantity) and the performance (quality) of their marketing efforts. By improving the personalization and relevance of their customer communications, marketers boosted customer engagement and loyalty, as evidenced by lifts in conversion rates, retention rates, and cross-sell rates. The organizations that layered BrazeAI Decisioning Studio on top of the core Braze customer engagement platform saw additional incremental benefits for the key campaigns they ran on the advanced platform. Key FindingsQuantified benefits. Three-year, risk-adjusted present value (PV) quantified benefits for the composite organization include:
Unquantified benefits. Benefits that provide value for the composite organization but are not quantified for this study include:
Costs. Three-year, risk-adjusted PV costs for the composite organization include:
The financial analysis that is based on the interviews found that a composite organization experiences benefits of $28.7 million over three years versus costs of $5.1 million, adding up to a net present value (NPV) of $23.5 million and an ROI of 457%.
|
|||||||||||||||||||||||||||||||||||||||||||||||||||||||||||||||||||||||||||||||||||||||||||||||||||||||||||||||||||||||||||||||||||||||||||||||||||||||||||||||||||||||||||||||||||||||||||||||||||||||||||||||||||||||||||||||||||||||||||||||||||||||||||||||||||||||||||||||||||||||||||||||||||||||||||||||||||||||||||||||||||||||||||||||||||||||||||||||||||||||||||||||||||||||||||||||||||||||||||||||||||||||||||||||||||||||||||||||||||||||||||||||||||||||||||||||||||||||||||||||||||||||||||||||||||||||||||||||||||||||||||||||||||||||||||||||||||||||||||||||||||||||||||||||||||||||||||||||||||||||||||||||||||||||||||||||||||||||||||||||||||||||||||||||||||||||||||||||||||||||||||||||||||||||||||||||||||||||||||||||||||||||||||||||||||||||||||||||||||||||||||||||||||||||||||||||||||||||||||||||||||||||||||||||||||||||||||||||||||||||||||||||||||||||||||||||||||||||||||||||||||||||
| Role | Industry | Revenue | Braze Deployment |
|---|---|---|---|
| Global head of lifecycle marketing | Creative app/software | $4 billion | Core platform (8 years) |
| Director of marketing technology and customer engagement | Healthcare retail | Not shared | Core platform (2 years) |
| Group manager of lifecycle TPM and database marketing | Financial services | $2.6 billion |
Core platform (7 years) BrazeAI Decisioning Studio (2 years) |
| Head of martech | Travel app/software | $608 million |
Core platform (8 years) BrazeAI Decisioning Studio (1 year) |
| Managing director of growth | Media | $1 billion |
Core platform (5 years) BrazeAI Decisioning Studio (4 years) |
| CRM and personalization senior manager | CPG | $22.4 billion |
Core platform (2 years) BrazeAI Decisioning Studio (just signed) |
Greater relevance leads to higher brand trust. Increasingly, according to consumers — particularly younger consumers — relevance requires personalization.
Forrester’s 2024 Media And Marketing Survey looked at customer demographics across a continuum of comfort level with personalized marketing content. Among the 22% of US online adults who were most comfortable with personalized experiences — called the Receptive group — the mean age was 42. In contrast, the mean age of the Avoidant group — those least receptive to personalized content — was 57.3
While marketing leaders recognize that personalization is a reality that their organizations must prepare for, that ask isn’t an easy one.
In a 2025 survey of global B2C marketing decision-makers, leaders said that improving customer experience, increasing customer engagement across the lifecycle, and understanding customers’ behaviors and motivations were among the most important parts of their marketing strategy over the next 12 months. In the same survey, leaders also ranked personalizing communications, experiences, and interactions fourth in a list of 15 common strategic and tactical hurdles, following closely behind measuring ROI, managing budget constraints, and managing data quality.4
As marketers look to answer this challenge, technology can be a huge part of the solution.
The six marketing leaders interviewed for this study said their organizations sought a new tool to run their most personalized marketing campaigns when their legacy technology held them back. Interviewees said their existing martech solutions were either cumbersome to use, limited in scope, or both.
Specifically, interviewees described a consistent pattern of limitations with legacy marketing platforms, including:
Dependence on technical resources to execute campaigns. Interviewees said their prior solutions required extensive support and ongoing involvement from engineers and developers, both to maintain the technology and to deploy marketing campaigns. These solutions lacked a user-friendly interface within which marketers could create workflows to build customer journeys and incorporate data segments. Marketers were even dependent on their more technical colleagues for creative development, as any creative work — whether all-new content or minor edits — required coding expertise. The managing director of growth for the media company explained, “We had 300 different things that our decisioning agents could choose from, and whenever we had to make a change across the board — say we changed our terms and conditions or our price — you had to manually change all 300 one by one.”
Lack of support for newer, mobile-based channels. All six interviewees said their organizations were almost exclusively using email for their marketing campaigns before adopting Braze. While email continues to be a cost-effective B2C marketing channel, nearly all their organizations wanted to add in-app messaging and SMS, which were mostly unavailable to them on their legacy platforms. One interviewee said their legacy platform provided in-app capability but did not support the customization that would have allowed them to deliver an on-brand experience. The managing director of growth for the media company said: “In terms of in-app messaging, we had a fixed template in colors and fonts that we couldn’t change. We’d ask the vendor, ‘Can we change this?’ They’d say, ‘Well, if enough customers ask, we’ll consider putting it on the roadmap.’”
As marketing teams move toward greater personalization, the variables used to create effective campaigns and to target them effectively multiply exponentially, which requires a system that can handle and process vast amounts of data. To fuel today’s — and tomorrow’s — highly personalized marketing campaigns, an organization’s martech ecosystem must include a solid customer data management foundation that provides a detailed, real-time understanding of customer behavior and preferences.5
While the leaders interviewed for this study understood this requirement, they also universally reported that their campaign volume increased tremendously once they had a tool that could support scalable growth. The CRM and personalization senior manager from the CPG company, for example, said that their team went from 16 campaigns the year before Braze to 450 just two years later, and they were on track to send 1,300 campaigns in the coming year.
The global head of lifecycle marketing for the creative app/software company shared: “I have 25+ years of marketing experience, and I’ve used a lot of enterprise-level tools. Most [of these previous vendors] would struggle to handle the volume of outbound sends and inbound data processing we do here. I’ve run into utilization caps and cases where APIs were overwhelmed and the back-end data processes were failing. [The ability to support] volume is what sets Braze apart.” Interviewees across the board agreed that support for both outbound scaling (number of campaigns and volume of messages) and inbound data processing (increasing the level of customer relevance for each individual message) were critical components of a marketing upleveling that included both quantity and quality lifts.
Based on the interviews, Forrester constructed a TEI framework, a composite company, and an ROI analysis that illustrates the areas financially affected. The composite organization is representative of the interviewees’ organizations, and it is used to present the aggregate financial analysis in the next section. The composite organization has the following characteristics:
Description of composite. The US-based, global media company has an annual revenue of $800 million. Its core product is a streaming entertainment service with a monthly subscription price of $10. The company has a customer base of 6.5 million subscribers in Year 1. Given its 8% monthly churn rate (52% annual churn rate) and 3% new-customer conversion rate, it must reach 100 to 150 million potential customers annually to meet its growth targets.
Deployment characteristics. The company begins using the Braze customer engagement platform in Year 1 following a four-month implementation period. Once this implementation is complete, it adds BrazeAI Decisioning Studio to further improve its cancel-save performance and to drive cross-sell conversions for a new streaming product. That implementation takes an additional three months, so the company is also able to begin running BrazeAI Decisioning Studio in Year 1.
KEY ASSUMPTIONS
$800 million annual revenue
6.5 million customers
Monthly subscription price of $10
Annual churn rate of 52%
First-purchase conversion rate of 3%
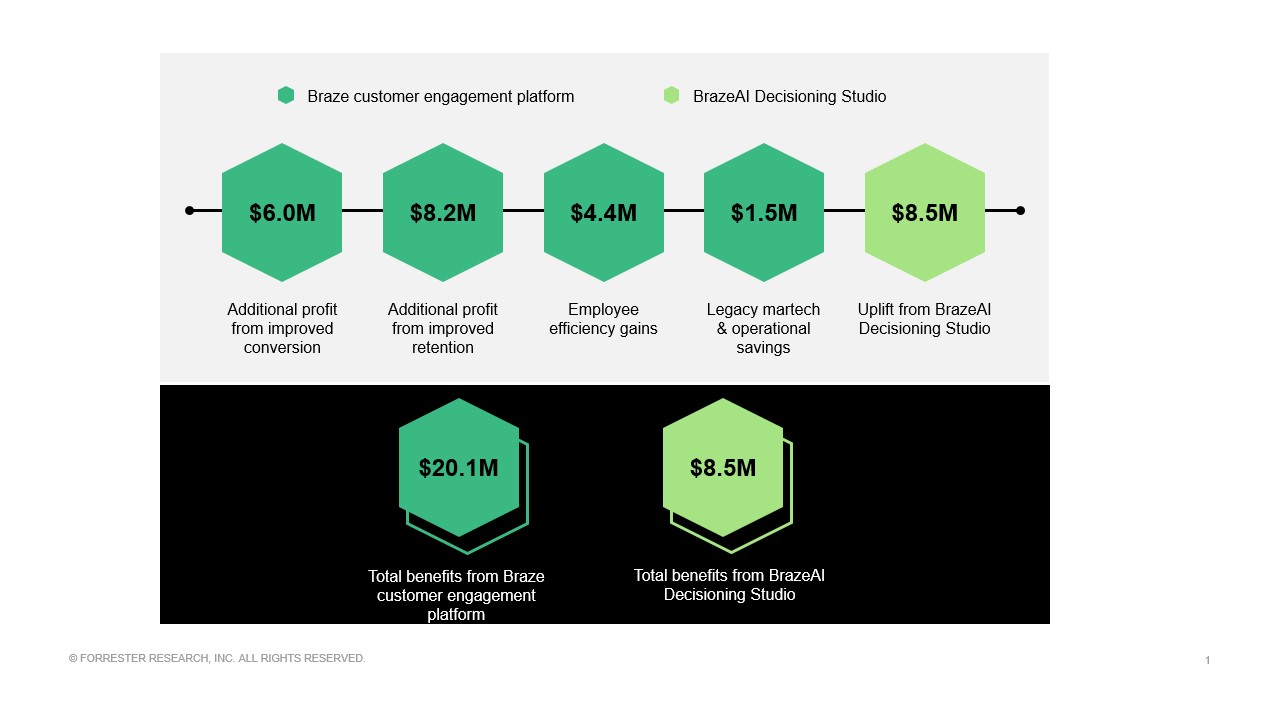
Quantified benefit data as applied to the composite
Total Benefits
| Ref. | Benefit | Year 1 | Year 2 | Year 3 | Total | Present Value |
|---|---|---|---|---|---|---|
| Atr | Additional profit from improved conversion | $777,600 | $2,332,800 | $4,536,000 | $7,646,400 | $6,042,807 |
| Btr | Additional profit from improved retention | $1,213,802 | $3,157,212 | $5,968,054 | $10,339,068 | $8,196,610 |
| Ctr | Employee efficiency gains | $181,688 | $1,816,875 | $3,633,750 | $5,632,313 | $4,396,810 |
| Dtr | Legacy martech and operational savings | $621,775 | $621,775 | $621,775 | $1,865,325 | $1,546,262 |
| Etr | Uplift from BrazeAI Decisioning Studio | $1,014,334 | $3,057,414 | $6,687,714 | $10,759,463 | $8,473,489 |
| Total benefits (risk-adjusted) | $3,809,199 | $10,986,076 | $21,447,293 | $36,242,568 | $28,655,978 |
Evidence and data. Interviewees said that after their organizations moved to Braze and could run more personalized campaigns at higher volumes, their conversion rates increased. These benefits compounded: Improved personalization drove higher conversion and retention, while increased efficiency allowed teams to scale campaigns and experimentation — further accelerating performance gains.
The group manager of lifecycle TPM and database marketing from the financial services organization summed it up this way: “The more it feels like a message is ‘for’ or ‘about’ a customer and not ‘to’ a customer — the more personalized a communication is — the more likely it is to convert. Those are the experiences we’re trying to create, and we’ve seen very positive results from those highly personalized campaigns.”
The global head of lifecycle marketing from the creative app/software company said their organization used events to introduce prospects to their products. Since they offer many different products that appeal to distinct user profiles, personalizing their marketing messages for those events was a key part of their strategy. The global head of lifecycle marketing said: “When we market events, between 38% and 52% of the traffic to key landing pages comes from our lifecycle campaign, which is run on Braze. So that means we’re contributing almost half of the total event ticket sales in some cases.”
The CRM and personalization senior manager from the CPG organization said they used Braze-powered messaging on their website to tailor content to each visitor based on their interests and behaviors: “We have some key areas where we know there’s high traffic and high click-through rates where we swap the standard component for a content card. From a user perspective, they don’t know what’s powered by our product team and what’s powered by Braze. They just notice, ‘Oh hey, this is more relevant to me,’ and that’s because Braze is sitting on all the data.”
The same interviewee shared that their company’s average overall conversion rate increased from 7% in 2024 to 17% in 2025, their first year with Braze. They noted: “That’s driving conversions of all kinds: creating an account, uploading a receipt to our app, building a profile, a whole host of things. I talk to my friends in performance marketing, and they’re after a 1% conversion.”
As interviewees compared their organizations’ conversion rates before Braze and with Braze, the average overall lift was 8% to 10% over a multiyear period.
Interview Spotlight
BrazeAI Agent Console Supports SMS Reorder Campaign
The director of marketing technology and customer engagement at a healthcare retailer shared an example of how the Braze customer engagement platform — and specifically, the BrazeAI Agent Console — helped them smooth a friction-filled hole in their customer journey.
As the director explained, they were using Braze to send SMS messages to customers who owned particular pieces of equipment to ask if they needed to reorder parts. If a customer needed to reorder a part of the same size, they could complete that purchase right in the SMS channel with a simple text response. However, if the customer needed a part in a different size, they had to place the order from the company website, which caused customers to drop out of the purchase funnel.
To automate this journey, the company started using the BrazeAI Agent Console embedded as steps in its Braze Canvas. The director realized that they could allow customers to complete any type of part purchase — regardless of the size needed — from within the SMS channel.
Now, if a customer needs a new part in a different size, an AI agent responds within the text thread asking what size they need. Unlike a traditional rules-based journey, the agent can work with natural language responses to: 1) infer that a size change has been requested and 2) interpret the customer’s description of the size they need. From there, the agent finds a matching product in the company catalog and confirms the order with the customer, all via SMS conversation.
According to the director, removing this “channel-change friction” generated an 8.8% lift in repurchase conversions. It also lowered operations costs by reducing the need for live customer service interactions for size-change reorders or orders resulting in returns.
Modeling and assumptions. Based on the interviews, Forrester assumes the following about the composite organization:
The composite reaches 100 million unique prospects in Year 1 through several entry points, including visits to its website and app stores. Prior to Braze, its historical conversion rate from visit to paid-subscription signup was 3%.
Once the organization begins to run its campaigns on Braze, it sees a 2% relative conversion rate lift in Year 1, which increases to 3% and 4% in Years 2 and 3, respectively. As it compares conversion rates before and after Braze, it sees an overall 9.3% lift in initial conversion rate from the beginning of Year 1 to the end of Year 3.
This lift results in a total incremental gain of 590,000 new customers across Years 1 to 3, for a total revenue impact of $70.8 million over the three years.
For the organization’s profit margin, Forrester uses the NYU Stern School of Business cross-industry average of 12%.6
Risks. Small differences in the various inputs can make a big bottom-line difference for companies that market in very high volumes. Here are a couple of situations where specific companies may see different results for this benefit.
Variations in order value and volume. This benefit fits a composite organization whose product is relatively low-cost (annual order value of $120) but has a large number of customers. Companies that sell higher-priced products at a lower volume may see their gains distributed differently across the various inputs.
Variations in conversion rate. The initial gross conversion rate used here (3%) is a typical benchmark for a midtier media company, but even a slight degree of variability can affect the overall value of the benefit.
Results. To account for these risks, Forrester adjusted this benefit downward by 10%, yielding a three-year, risk-adjusted total PV (discounted at 10%) of $6 million.
9.3%
Conversion rate lift, Years 1 to 3
590,000
New customers converted, Years 1 to 3
$70.8 million
Three-year revenue impact
Additional Profit From Improved Conversion
| Ref. | Metric | Source | Year 1 | Year 2 | Year 3 | |
|---|---|---|---|---|---|---|
| A1 | Unique entry-point visits (website, app store) | Composite | 100,000,000 | 120,000,000 | 125,000,000 | |
| A2 | Conversion rate before Braze | Composite | 3% | 3% | 3% | |
| A3 | New customers acquired before Braze | A1*A2 | 3,000,000 | 3,600,000 | 3,750,000 | |
| A4 | Relative year-over-year lift in conversion rate with Braze | Interviews | 2% | 3% | 4% | |
| A5 | Conversion rate with Braze lift |
Year 1: A2*(1+A4) Year 2: A5Y1*(1+A4) Year 3: A5Y2*(1+A4) |
3.06% | 3.15% | 3.28% | |
| A6 | Additional customers acquired due to Braze | A1*(A5-A2) | 60,000 | 180,000 | 350,000 | |
| A7 | Annual order value | Composite | $120 | $120 | $120 | |
| A8 | Subtotal: Revenue from additional conversions | A6*A7 | $7,200,000 | $21,600,000 | $42,000,000 | |
| A9 | Profit margin | Research data | 12% | 12% | 12% | |
| At | Additional profit from improved conversion | A8*A9 | $864,000 | $2,592,000 | $5,040,000 | |
| Risk adjustment | ↓10% | |||||
| Atr | Additional profit from improved conversion (risk-adjusted) | $777,600 | $2,332,800 | $4,536,000 | ||
| Three-year total: $7,646,400 | Three-year present value: $6,042,807 | |||||
Evidence and data. Interviewees said that Braze helped their teams boost engagement, which led to higher customer retention.
The global head of lifecycle marketing from the creative app/software company said that being able to create highly personalized newsletters in Braze helped them keep more active users in their customer base (retention) and in their marketing audience (reach). They explained: “Braze helps us increase our reach and maintain engagement among our active users. Our reach has increased due to Braze because we’re offering recurring newsletters, which drive habitual use of our product. The more people we can get a great newsletter to, the higher the engagement and the more people who stay in our active, eligible audience. So we’re able to maintain more active users over time with this strategy.”
Interviewees also said the ability to connect disparate data points using the Braze Data Platform to convert anonymous visitors into known users also drove higher engagement. The CRM and personalization senior manager for a CPG organization explained: “Web engagement is good, but if we get them over to our app, it’s even better, and then it’s even higher as we get them to further engage in key features in the app. When we look at the volume of users, Braze alone contributed 15% of our registered user volume.”
Modeling and assumptions. Based on the interviews, Forrester assumes the following about the composite organization:
The total customers for each year reflects the composite organization’s initial conversion rate of 3% and baseline annual retention rate of 48%.
After moving to Braze, the organization experiences an overall 11.4% relative lift in retention rate across the three-year period. The incremental year-over-year lifts increase from Year 1 to Year 3 as the composite’s marketing team becomes more familiar with the Braze platform and implements best practices.
This lift results in a total incremental gain of 798,000 additional customers retained across Years 1 to 3, for a total revenue impact of $95.7 million over the three years.
The retention rate modeled in this section does not include the additional marketing efforts required for cancel-save, when a customer initiates cancellation of a subscription. That activity is modeled in Benefit E.
Risks. Once again, small variations multiplied across large volumes can have a big impact on the total value of this benefit. As readers model this benefit for their own organizations, they will likely see differences in the annual retention rate and the annual order value, depending on their industry sector, product value, and pricing structure.
Results. To account for these risks, Forrester adjusted this benefit downward by 10%, yielding a three-year, risk-adjusted total PV (discounted at 10%) of $8.2 million.
11.4%
Retention rate lift, Years 1 to 3
798,000
More customers retained, Years 1 to 3
$95.7 million
Three-year revenue impact
Additional Profit From Improved Retention
| Ref. | Metric | Source | Year 1 | Year 2 | Year 3 | |
|---|---|---|---|---|---|---|
| B1 | Total customers | Composite | 6,504,000 | 7,123,164 | 8,418,604 | |
| B2 | Annual gross retention rate before Braze | Composite | 48% | 48% | 48% | |
| B3 | Customers retained before Braze | B1*B2 | 3,121,920 | 3,419,119 | 4,040,930 | |
| B4 | Relative year-over-year lift in annual gross retention rate with Braze | Interviews | 3% | 4% | 4% | |
| B5 | Annual gross retention rate with Braze lift |
Year 1: B2*(1+B4) Year 2: B5Y1*(1+B4) Year 3: B5Y2*(1+B4) |
49.44% | 51.42% | 53.47% | |
| B6 | Subtotal: Additional customers retained due to Braze | B1*(B5-B2) | 93,658 | 243,612 | 460,498 | |
| B7 | Annual order value | A7 | $120 | $120 | $120 | |
| B8 | Subtotal: Year-over-year revenue lift from retained customers | B6*B7 | $11,238,912 | $29,233,440 | $55,259,760 | |
| B9 | Profit margin | A9 | 12% | 12% | 12% | |
| Bt | Additional profit from improved retention | B8*B9 | $1,348,669 | $3,508,013 | $6,631,171 | |
| Risk adjustment | ↓10% | |||||
| Btr | Additional profit from improved retention (risk-adjusted) | $1,213,802 | $3,157,212 | $5,968,054 | ||
| Three-year total: $10,339,068 | Three-year present value: $8,196,610 | |||||
Evidence and data. Because of the user-friendliness of the Braze interface, interviewees said that marketers were less dependent on data engineers to create and send their campaigns, and they could finish tasks much faster. Not only could marketing departments do more with the same size team, but they could also scale the volume of their communications like never before. These improvements supported a faster time to launch and faster learning and refinement, and they allowed marketers to focus more of their time on creativity and strategy, as opposed to operational effort.
The group manager of lifecycle TPM and database marketing from the financial services company said: “Braze is very user-friendly. It’s simple enough that if you are in a marketing role where you wear lots of hats, Braze is a tool that marketers can use end to end. You don’t need to be an engineer to configure things. You can also create and templatize things quite well. Features like drag-and-drop and HTML editors are huge for productivity.”
The same interviewee estimated their team’s time savings: “I know I can probably build a customer journey end to end in 10 to 15 minutes. For a less experienced user, it might take an hour. I definitely couldn’t send something with [our prior solution] in that time. It physically queried our database from an external connection that took so much time that it wasn’t possible to generate an audience that quickly. It probably took four times longer.”
The CRM and personalization senior manager from the CPG company said Braze’s use of Content Cards that can be swapped in and out make it fast and easy to build highly customized campaigns. They shared: “We’re seeing time savings in creative development because now we have more standard templates and components in Braze. For journey orchestration, even though the message, brand elements, or segmentation may be slightly different from one campaign to the next, the flow and the touchpoints are all the same. So we’re seeing efficiencies there, too. And same thing from an analytics perspective in terms of the measurement.”
When interviewees were asked to talk about efficiency, they all said the story was less about time savings and more about Braze enabling a level of productivity that wasn’t previously possible. For example, the managing director of growth from the media company, who lamented having to manually and individually change terms and conditions across 300 pieces of content in their former system, said Braze workflows enabled an explosion of personalized messaging volume. They said: “Because Braze is built on canvases, you make one change and it flows through everything. And that’s why overnight we went from hundreds of variations to over a million.”
All interviewees noted that the level of output they’d achieved with Braze had transcended the limits of what would be possible with their former system. The global head of lifecycle marketing from the creative app/software company talked about how being able to experiment at such high volumes supported rapid learning and performance improvement: “With Braze, we can experiment much faster. We do upward of 50 experiments every year, and they’re often quite complex. In our onboarding program, for example, we have active experiments that test different pieces of content. In that program alone, we have dozens of different variations that are being handled by the logic in Braze. It would just be unmanageable if we didn’t have this tool.”
Across the six organizations, interviewees reported that their time to launch improved dramatically after moving to Braze. According to the respective interviewees, the healthcare retail company’s hands-on time went from four weeks to 5 minutes, and the financial services company went from 4 hours to 1 hour. The CPG company reduced its launch time from 51 days to 28 days, and its CRM and personalization senior manager said they once launched a campaign in 48 minutes.
Modeling and assumptions. Based on the interviews, Forrester assumes the following about the composite organization:
Taking the most conservative time-to-launch reduction from the interviews, the composite organization reduces its average time to launch by 20 days after moving to Braze. Within this time frame and based on interviewee input, the company’s marketing team saves dozens of hours per campaign across the various stages of work, from creative development to journey orchestration to data segmentation to post-campaign performance analysis.
Additionally, the organization saves 90 engineering hours on each campaign since marketers can self-serve in the Braze platform without depending on ongoing technical assistance.
The composite organization experiences high growth in the number of campaigns it executes per year.
Forrester applies a 50% productivity recapture rate to the time savings enabled by Braze as not all time saved will be repurposed for high-value work.
Risks. Employee time savings across marketing work can vary based on several factors, including:
The team’s organizational structure, level of engagement, and each employee’s experience level.
The number of campaigns run in a year.
The level of effort required for each individual campaign. Interviewees universally described explosive, if not exponential, growth in annual marketing activity after moving to Braze. While they quantified this activity in terms of number of campaigns, the definition of a “campaign” can vary from one marketing team to another and isn’t always a consistent or linear indicator of level of effort. One campaign may be a copy of last year’s promotion with minor copy changes, while another may be an entirely new concept around a product launch.
Results. To account for these risks, Forrester adjusted this benefit downward by 15%, yielding a three-year, risk-adjusted total PV (discounted at 10%) of $4.4 million.
20
Fewer days to launch
Employee Efficiency Gains
| Ref. | Metric | Source | Year 1 | Year 2 | Year 3 | |
|---|---|---|---|---|---|---|
| C1 | Marketer time savings per campaign: creative and content development (hours) | Interviews | 30 | 30 | 30 | |
| C2 | Marketer time savings per campaign: journey orchestration (hours) | Interviews | 30 | 30 | 30 | |
| C3 | Marketer time savings per campaign: customer data segmentation (hours) | Interviews | 60 | 60 | 60 | |
| C4 | Marketer time savings per campaign: performance analysis (hours) | Interviews | 20 | 20 | 20 | |
| C5 | Subtotal: Marketing employee time savings per campaign (hours) | C1+C2+C3+C4 | 140 | 140 | 140 | |
| C6 | Fully burdened hourly rate for a marketing employee | Composite | $54 | $54 | $54 | |
| C7 | Subtotal: Marketing employee cost savings per campaign | C5*C6 | $7,560 | $7,560 | $7,560 | |
| C8 | Engineering time savings per campaign (hours) | Interviews | 90 | 90 | 90 | |
| C9 | Fully burdened hourly rate for an engineer | Composite | $106 | $106 | $106 | |
| C10 | Subtotal: Engineering cost savings per campaign | C8*C9 | $9,540 | $9,540 | $9,540 | |
| C11 | Campaigns per year | Composite | 25 | 250 | 500 | |
| C12 | Productivity recapture | TEI methodology | 50% | 50% | 50% | |
| Ct | Employee efficiency gains | $213,750 | $2,137,500 | $4,275,000 | ||
| Risk adjustment | ↓15% | |||||
| Ctr | Employee efficiency gains (risk-adjusted) | $181,688 | $1,816,875 | $3,633,750 | ||
| Three-year total: $5,632,313 | Three-year present value: $4,396,810 | |||||
Evidence and data. Interviewees remarked that moving from a highly complex and engineer-dependent martech solution to Braze also reduced ongoing operational expenses by reducing their dependence on developers and engineers.
The managing director of growth for the media company noted: “We used to have a team of contractors who would just keep [our prior solution] running. We got rid of that completely, so that was a significant cost savings. We were spending a million dollars a year on contractors just to keep the thing running. Now, with Braze, I’ve got two people in martech who make tweaks or build integrations. So the cost is less, and it’s about augmentation, not just maintenance.”
The global head of lifecycle marketing for the creative app/software company said: “Supporting Braze is a single data engineer’s job now versus two or three people before. We’re saving $400,000 a year, easily.”
Modeling and assumptions. Based on the interviews, Forrester assumes the following about the composite organization:
The company retires its legacy solution in Year 1, sunsetting an annual licensing cost of $400,000.
The composite also reduces the level of engineer maintenance effort required. While some internal maintenance effort is still required for Braze (see Cost G), the composite reduces its engineering labor investment from two FTEs at 75% of their time to one FTE dedicating 30% of their time to managing the core Braze engagement platform. This represents an 80% annual engineering labor savings. Considering the total deployment — the core Braze engagement platform plus BrazeAI Decisioning Studio — the organization still requires less technical support to manage both solutions (0.55 FTEs annually for both Braze platforms, versus 1.5 FTEs annually for the legacy platform).
Risks. Individual companies will see some variability in the scale of this benefit based on the cost of their prior marketing solution, when it is fully retired, and the level of engineering effort (internal and/or external) required to maintain it.
Results. To account for these risks, Forrester adjusted this benefit downward by 15%, yielding a three-year, risk-adjusted total PV (discounted at 10%) of $1.5 million.
80%
Annual labor savings in engineering support required for Braze vs. legacy solution
Legacy Martech And Operational Savings
| Ref. | Metric | Source | Year 1 | Year 2 | Year 3 | |
|---|---|---|---|---|---|---|
| D1 | Avoided licensing costs from offloaded martech solutions | Composite | $400,000 | $400,000 | $400,000 | |
| D2 | Engineers supporting prior martech solution (FTEs) | Composite | 2 | 2 | 2 | |
| D3 | Portion of time dedicated to martech solution support | Composite | 75% | 75% | 75% | |
| D4 | Fully burdened annual salary for an engineer | Composite | $221,000 | $221,000 | $221,000 | |
| D5 | Subtotal: Avoided engineer maintenance cost for prior martech solution | D2*D3*D4 | $331,500 | $331,500 | $331,500 | |
| Dt | Legacy martech and operational savings | D1+D5 | $731,500 | $731,500 | $731,500 | |
| Risk adjustment | ↓15% | |||||
| Dtr | Legacy martech and operational savings (risk-adjusted) | $621,775 | $621,775 | $621,775 | ||
| Three-year total: $1,865,325 | Three-year present value: $1,546,262 | |||||
Evidence and data. In addition to the performance uplift, time savings, and operational savings that interviewees saw across all their marketing activities with the core Braze customer engagement platform, the organizations that also implemented BrazeAI Decisioning Studio for true 1:1 personalization saw additional incremental benefits for certain key use cases.
Reactivation was a common use case. The media company factored dynamic pricing into its BrazeAI Decisioning Studio “cancel-save” reactivation campaigns. Its managing director of growth explained: “We have a couple of different pricing tiers for each product, and we have a large churn base as well that we target with reactivation offers through Braze. We use BrazeAI Decisioning Studio to effectively dynamically price those offers to every customer when we need to. Sometimes, there’s a short-term discount to get a customer to reactivate, and we give the [agent] the ability to basically pick any price for any customer at any time. But pricing is just one of the things that we optimize on. More generally, it’s, ‘What is the right piece of comms, whether it’s content-driven or whether it’s offer-driven, that is going to trigger a customer to come back to the product?’ [We don’t want to give] value away to people who would come back on their own.”
Cross-sell was another common use case. The financial services organization turned to BrazeAI Decisioning Studio to further personalize its cross-sell journeys for customers who currently use its basic banking services and were good referral candidates for its lending products.
The CRM and personalization senior manager from the CPG company explained the natural fit between personalization, engagement, and cross-sell: “What we’ve seen is that as consumers engage more with our digital ecosystem, they’re more loyal, and they’re more open to cross-sell. That’s part of what we’re here to deliver with personalization with Braze.”
The interviewees whose organizations were using both Braze products were able to parse out attribution of general benefits due to the core Braze customer engagement platform, versus the incremental uplift over “business as usual” for their key 1:1 personalization campaigns run on BrazeAI Decisioning Studio. Interviewees from the media company and one of the app/software companies were able to share specific metrics, while the interviewee from the financial services organization spoke qualitatively, validating the significant uplift.
The interviewee from the travel app/software company ran a second-transaction conversion campaign on BrazeAI Decisioning Studio. Their business-as-usual in this case was a segmented campaign running on the core Braze customer engagement platform, targeting new customers within the seven-to-14-day window after their initial purchase, and incentivizing a repeat purchase. By moving these campaigns to BrazeAI Decisioning Studio and achieving true 1:1 personalization, they saw their second-purchase conversion rate increase by 81% from their baseline activity over a three-month period. The head of martech at the travel app/software company said, “This is important because we learned that the customers who make a second purchase within two weeks of their first are highly likely to become our highest-value customers over time.”
Modeling and assumptions. Based on the interviews, Forrester assumes the following about the composite organization:
For the Cancel-Save Use Case:
For the Cross-Sell Use Case:
Risks. The risks for variability discussed in the previous sections also apply here; once again, small variations in conversion rates and reactivation rates can have a notable impact on the total value of the benefit. In addition, a product like BrazeAI Decisioning Studio requires a sophisticated marketing organization, which — as the CRM and personalization senior manager from the CPG organization explained — involves both a strong appetite for experimentation (and potential failure) and a budget healthy enough to fund it. They said: “At our company, there’s so much appetite for experimenting, bringing on new tools, and doing proofs of concept to incubate things and see what happens. We have a spirit of entrepreneurship and exploration that is fantastic to be a part of.”
Results. To account for these risks, Forrester adjusted this benefit downward by 10%, yielding a three-year, risk-adjusted total PV (discounted at 10%) of $8.5 million.
$22.9 million
Three-year revenue gains from cancel-save use case
$76.7 million
Three-year revenue gains from cross-sell use case
Uplift From BrazeAI Decisioning Studio
| Ref. | Metric | Source | Year 1 | Year 2 | Year 3 | |
|---|---|---|---|---|---|---|
| E1 | Total customers | Composite | 6,504,000 | 7,123,164 | 8,418,604 | |
| E2 | Customers who initiate the cancel process | E1*(1-B5) | 3,288,422 | 3,460,604 | 3,916,814 | |
| E3 | Customer reactivation rate before BrazeAI Decisioning Studio | Composite | 20% | 20% | 20% | |
| E4 | Customers cancel-saved before BrazeAI Decisioning Studio | E2*E3 | 657,684 | 692,121 | 783,363 | |
| E5 | Lift in customer reactivation rate with BrazeAI Decisioning Studio | Interviews | 3% | 5% | 6% | |
| E6 | Customer reactivation rate with BrazeAI Decisioning Studio |
Year 1: E3*(1+E5) Year 2: E6Y1*(1+E5) Year 3: E6Y2*(1+E5) |
20.60% | 21.63% | 22.93% | |
| E7 | Subtotal: Additional customers saved with BrazeAI Decisioning Studio | E2*(E6-E3) | 19,731 | 56,408 | 114,763 | |
| E8 | Annual order value | A7 | $120 | $120 | $120 | |
| E9 | Subtotal: Revenue from cancel-save use case | E7*E8 | $2,367,664 | $6,768,941 | $13,771,560 | |
| E10 | Cross-sell conversion rate before BrazeAI Decisioning Studio | Composite | 4.5% | 4.5% | 4.5% | |
| E11 | Lift in cross-sell conversion rate with BrazeAI Decisioning Studio | Interviews | 20.00% | 30.00% | 32.00% | |
| E12 | Cross-sell conversion rate with BrazeAI Decisioning Studio | E10*(1+E11) | 5.40% | 7.02% | 9.27% | |
| E13 | Subtotal: Additional customers who buy new product with BrazeAI Decisioning Studio | E1*(E12-E10) | 58,536 | 179,504 | 401,264 | |
| E14 | Annual value of new product | Composite | $120 | $120 | $120 | |
| E15 | Subtotal: Revenue from cross-sell use case | E13*E14 | $7,024,320 | $21,540,448 | $48,151,721 | |
| E16 | Profit margin | A9 | 12% | 12% | 12% | |
| Et | Uplift from BrazeAI Decisioning Studio | (E9+E15)*E16 | $1,127,038 | $3,397,127 | $7,430,794 | |
| Risk adjustment | ↓10% | |||||
| Etr | Uplift from BrazeAI Decisioning Studio (risk-adjusted) | $1,014,334 | $3,057,414 | $6,687,714 | ||
| Three-year total: $10,759,463 | Three-year present value: $8,473,489 | |||||
Interviewees mentioned the following additional benefits that their organizations experienced but were not able to quantify:
Improved customer experience. Offering more personalized marketing boosts sales performance precisely because it creates a better customer experience. While CX improvement in itself can’t be as easily and objectively measured as the end result — higher conversion, retention, and revenue for the company selling the product — it is nonetheless a significant benefit. The global head of lifecycle marketing for the creative app/software company shared, “With Braze, customers receive a much more tailored set of content in their inbox.”
For the healthcare retail company that participated in this study, greater messaging personalization in emails and on its website through Braze-enabled content cards allowed the marketing team to provide specific and accurate prices for the brand’s home healthcare products. The company’s director of marketing technology and customer engagement said: “Before Braze, we couldn’t tell the customer the actual price of the item being promoted in the email because there were so many variations based on insurance coverage. Imagine trying to make a decision on a home medical device that might be free, or might cost several hundred dollars. Now, with Braze, we can give the customer the pricing information that pertains to them, which helps them make a better purchasing decision.”
Increased business agility. Several interviewees described how the Braze platform — and specifically, its ability to aggregate, augment, and share data insights bidirectionally — had helped break down silos within their organizations. The CRM and personalization senior manager from the CPG company said: “One key difference, when I look at how we were activating before versus where we are now, is we now have set KPIs that are aligned with the business. We’re operating much more like an agile shop and constantly delivering value.”
Enhanced opportunity to learn from other Braze customers. Leaders also mentioned the valuable networking available through Braze events and the Braze Bonfire community, where they could discuss challenges and best practices with their peers in other industry verticals. The group manager of lifecycle TPM and database marketing from the financial services company explained, “The conferences I’ve been to with Braze have been ahead of the pack as far as more advanced feature adoption and scale of use.” The CRM and personalization senior manager at the CPG firm elaborated: “Part of what Braze is bringing to the table, less tangible than the capabilities, is the sharing of use cases. I can talk to my peers in different industries about how to use the same tactics. We always want to know what everybody else is doing, and that part is really advantageous.”
The flexibility opportunities outlined below acknowledge that different companies may realize additional sources of value from Braze due to industry- or company-specific use cases. Some of these scenarios explored in the customer interviews included:
The ability to respond rapidly to changing market conditions. The capacity to launch campaigns faster, which was explored in Benefit C, may bring more than simple time savings and productivity gains in certain circumstances. For example, when the CPG company pushed a last-minute promotional campaign through its app in a record 48 minutes, customer response helped it deliver the additional registered users it needed to meet its quarterly goal. And when the same company used Braze to target buyers of a competing brand with an in-store coupon, it saw a 26% increase in purchases for one product line and a 10% increase for the other. According to the company’s CRM and personalization senior manager, the team launched this campaign within four weeks of being alerted to the product’s underperformance. The senior manager said: “Moving to Braze has meant that we can move fast, and because of the way the platform works, we can deliver really quickly. It’s allowed us to take things that are happening in the marketplace and directly respond to them.”
The opportunity to earn partnership or ad revenue. The head of martech at the travel app/software company said they ran several successful campaigns in which they pushed partner ads to the user base. In one six-week test with a gaming app and a language-learning app, the company earned $85,000 in revenue by showing its users special offers from relevant, noncompeting partners. The head of martech said, “When you can [run these partnership campaigns] with three and a half million users, you can get some decent results, and the learnings you get are also pretty useful.”
The ability to leverage audiences for internal loyalty-building programs. Leveraging a base of loyal, known users isn’t limited to external partnerships; companies can also cross-promote internally. For example, the CPG company ran a sampling-and-review promotion program — which it traditionally had run with a third-party consultant — on its own app, using the Braze platform. Not only did it save on third-party fees, but it got better results by leveraging its own highly engaged users. The CRM and personalization senior manager said: “When we were running that program with a third party, it would typically take eight weeks. We were able to do it in six because the users were more engaged — and there was an additional halo effect of each user submitting more reviews. The rule of thumb is that a strong review increases conversion rate 10% in our category, so it was a valuable investment.”
Flexibility would also be quantified when evaluated as part of a specific project (described in more detail in Total Economic Impact Approach).
Quantified cost data as applied to the composite
Total Costs
| Ref. | Cost | Initial | Year 1 | Year 2 | Year 3 | Total | Present Value |
|---|---|---|---|---|---|---|---|
| Ftr | Licensing | $0 | $759,000 | $803,000 | $1,034,000 | $2,596,000 | $2,130,496 |
| Gtr | Implementation and support costs | $320,735 | $162,495 | $162,495 | $162,495 | $808,220 | $724,836 |
| Htr | BrazeAI Decisioning Studio costs | $254,150 | $817,075 | $817,075 | $817,075 | $2,705,375 | $2,286,095 |
| Total costs (risk-adjusted) | $574,885 | $1,738,570 | $1,782,570 | $2,013,570 | $6,109,595 | $5,141,427 |
Evidence and data. Braze provided approximate licensing costs that were in line with the scale of platform costs and annual messaging volume likely for the composite. Forrester then validated this information against the cost benchmarks provided by the six interviewees.
Modeling and assumptions. Based on the interviews, Forrester assumes that the composite organization’s utilization and data costs are in the upper quartile of typical cost ranges shared by the interviewees. This reflects the composite’s enterprise size and large-scale messaging volume. Costs for utilization and data also increase faster over the three-year period than do Braze’s platform costs, due to the rapid growth of the composite organization’s messaging volume after moving to Braze.
Risks. Licensing costs may vary from organization to organization depending on:
The messaging volume across channels each year.
The number of MAUs.
The maturity of an organization’s customer engagement journey and the complexity of its channel mix.
The number of additional services and level of customer support desired.
Results. Forrester adjusted this cost upward by 10% to reflect potential variability in utilization and messaging growth. This yields a three-year, risk-adjusted total PV (discounted at 10%) of $2.1 million.
Licensing
| Ref. | Metric | Source | Initial | Year 1 | Year 2 | Year 3 |
|---|---|---|---|---|---|---|
| F1 | Braze platform and services | Braze | $50,000 | $50,000 | $60,000 | |
| F2 | Utilization fees (based on channels and MAU) | Braze | $555,000 | $590,000 | $785,000 | |
| F3 | Data plan | Braze | $85,000 | $90,000 | $95,000 | |
| Ft | Licensing | F1+F2+F3 | $0 | $690,000 | $730,000 | $940,000 |
| Risk adjustment | ↑10% | |||||
| Ftr | Licensing (risk-adjusted) | $0 | $759,000 | $803,000 | $1,034,000 | |
| Three-year total: $2,596,000 | Three-year present value: $2,130,496 | |||||
Evidence and data. Interviewees shared their organizations’ approaches to implementation, overall timelines, and level of internal and external effort required to launch Braze and manage it over time.
The implementation timelines for the core Braze customer engagement platform were fairly consistent across the six interviewees, ranging from six to nine months.
None of the interviewees used third-party contractors for implementation, and most organizations didn’t need any additional ongoing professional services support from Braze beyond what was included in their contract.
The CRM and personalization senior manager at the CPG company said their team felt more comfortable with Braze’s top-tier support package, which came at an additional cost of $80,000 but provided a very positive experience. They said: “Braze assigned a solution architect and an onboarding manager. So you’ve essentially got a capabilities perspective and a technical perspective that goes everywhere with your team. They also provide a template for your use cases and how you want to flesh them out. In general, the process was super easy to follow.”
Modeling and assumptions. Based on the interviews, Forrester assumes the following about the composite organization:
The organization finishes setup of the core Braze customer engagement platform in four months, with implementation costs captured in the Initial period.
The composite pays a modest annual cost for premium Braze support.
The composite dedicates three employees to the initial four-month setup. The company needs one engineer for ongoing support, and that person dedicates 30% of their time to Braze-related activities.
Risks. Different companies will have different approaches to implementation and support. While some companies manage these efforts entirely in-house, others rely on third-party systems integrators and contractors. Teams also have varying levels of technical expertise and troubleshooting ability. Finally, labor costs may also vary by location.
Results. To account for these risks, Forrester adjusted this cost upward by 15%, yielding a three-year, risk-adjusted total PV (discounted at 10%) of $725,000.
Implementation And Support Costs
| Ref. | Metric | Source | Initial | Year 1 | Year 2 | Year 3 |
|---|---|---|---|---|---|---|
| G1 | Braze professional services | Composite | $80,000 | $75,000 | $75,000 | $75,000 |
| G2 | Internal engineers (FTEs) | Composite | 3 | 1 | 1 | 1 |
| G3 | Portion of time FTEs dedicated to implementation and management efforts | Composite | 30% | 30% | 30% | 30% |
| G4 | Fully burdened annual salary for an engineer | D4 | $221,000 | $221,000 | $221,000 | $221,000 |
| Gt | Implementation and support costs | G1+(G2*G3*G4) | $278,900 | $141,300 | $141,300 | $141,300 |
| Risk adjustment | ↑15% | |||||
| Gtr | Implementation and support costs (risk-adjusted) | $320,735 | $162,495 | $162,495 | $162,495 | |
| Three-year total: $808,220 | Three-year present value: $724,836 | |||||
Evidence and data. As a separate product from the core Braze customer engagement platform, BrazeAI Decisioning Studio has its own pricing, which includes a deeper scope of consultative service than is typically provided with SaaS licensing to support advanced AI use cases. Braze prices BrazeAI Decisioning Studio based on an estimated flat fee per use case. That cost information was provided by Braze and validated by the interviewees whose organizations currently use BrazeAI Decisioning Studio.
Modeling and assumptions. Based on the interviews, Forrester assumes the following about the composite organization:
The composite runs two use cases through BrazeAI Decisioning Studio and pays two per-use-case platform fees of $300,000 each.
The composite dedicates additional internal engineering time to support initial implementation and ongoing management of these two use cases. That time adds up to 0.5 FTEs per use case for initial implementation and 0.25 FTEs per use case for ongoing management.
Risks. The level of internal support a company dedicates to BrazeAI Decisioning Studio, and the associated labor costs, are the only sources of variability risk in this cost category.
Results. To account for these risks, Forrester adjusted this cost upward by 15%, yielding a three-year, risk-adjusted total PV (discounted at 10%) of $2.3 million.
BrazeAI Decisioning Studio Costs
| Ref. | Metric | Source | Initial | Year 1 | Year 2 | Year 3 |
|---|---|---|---|---|---|---|
| H1 | Cost per use case | Braze | $0 | $300,000 | $300,000 | $300,000 |
| H2 | Use cases | Composite | 2 | 2 | 2 | 2 |
| H3 | Subtotal: Licensing cost | H1*H2 | $0 | $600,000 | $600,000 | $600,000 |
| H4 | Internal engineers (FTEs) | Composite | 0.50 | 0.25 | 0.25 | 0.25 |
| H5 | Fully burdened annual salary for an engineer | D4 | $221,000 | $221,000 | $221,000 | $221,000 |
| H6 | Subtotal: Internal support cost | H2*H4*H5 | $221,000 | $110,500 | $110,500 | $110,500 |
| Ht | BrazeAI Decisioning Studio costs | H3+H6 | $221,000 | $710,500 | $710,500 | $710,500 |
| Risk adjustment | ↑15% | |||||
| Htr | BrazeAI Decisioning Studio costs (risk-adjusted) | $254,150 | $817,075 | $817,075 | $817,075 | |
| Three-year total: $2,705,375 | Three-year present value: $2,286,095 | |||||
Consolidated Three-Year, Risk-Adjusted Metrics
Cash Flow Analysis (Risk-Adjusted)
| Initial | Year 1 | Year 2 | Year 3 | Total | Present Value | |
|---|---|---|---|---|---|---|
| Total costs | ($574,885) | ($1,738,570) | ($1,782,570) | ($2,013,570) | ($6,109,595) | ($5,141,427) |
| Total benefits | $0 | $3,809,199 | $10,986,076 | $21,447,293 | $36,242,568 | $28,655,978 |
| Net benefits | ($574,885) | $2,070,629 | $9,203,506 | $19,433,723 | $30,132,973 | $23,514,551 |
| ROI | 457% | |||||
| Payback | <6 months |
Please Note
The financial results calculated in the Benefits and Costs sections can be used to determine the ROI and NPV for the composite organization’s investment. Forrester assumes a yearly discount rate of 10% for this analysis.
These risk-adjusted ROI and NPV values are determined by applying risk-adjustment factors to the unadjusted results in each Benefit and Cost section.
The initial investment column contains costs incurred at “time 0” or at the beginning of Year 1 that are not discounted. All other cash flows are discounted using the discount rate at the end of the year. PV calculations are calculated for each total cost and benefit estimate. NPV calculations in the summary tables are the sum of the initial investment and the discounted cash flows in each year. Sums and present value calculations of the Total Benefits, Total Costs, and Cash Flow tables may not exactly add up, as some rounding may occur.
From the information provided in the interviews, Forrester constructed a Total Economic Impact™ framework for those organizations considering an investment in Braze.
The objective of the framework is to identify the cost, benefit, flexibility, and risk factors that affect the investment decision. Forrester took a multistep approach to evaluate the impact that Braze can have on an organization.
Due Diligence
Interviewed Braze stakeholders and Forrester analysts to gather data relative to Braze.
Interviews
Interviewed six decision-makers at organizations using Braze to obtain data about costs, benefits, and risks.
Composite Organization
Designed a composite organization based on characteristics of the interviewees’ organizations.
Financial Model Framework
Constructed a financial model representative of the interviews using the TEI methodology and risk-adjusted the financial model based on issues and concerns of the interviewees.
Case Study
Employed four fundamental elements of TEI in modeling the investment impact: benefits, costs, flexibility, and risks. Given the increasing sophistication of ROI analyses related to IT investments, Forrester’s TEI methodology provides a complete picture of the total economic impact of purchase decisions. Please see Appendix A for additional information on the TEI methodology.
Benefits
Benefits represent the value the solution delivers to the business. The TEI methodology places equal weight on the measure of benefits and costs, allowing for a full examination of the solution’s effect on the entire organization.
Costs
Costs comprise all expenses necessary to deliver the proposed value, or benefits, of the solution. The methodology captures implementation and ongoing costs associated with the solution.
Flexibility
Flexibility represents the strategic value that can be obtained for some future additional investment building on top of the initial investment already made. The ability to capture that benefit has a PV that can be estimated.
Risks
Risks measure the uncertainty of benefit and cost estimates given: 1) the likelihood that estimates will meet original projections and 2) the likelihood that estimates will be tracked over time. TEI risk factors are based on “triangular distribution.”
Present value (PV)
The present or current value of (discounted) cost and benefit estimates given at an interest rate (the discount rate). The PVs of costs and benefits feed into the total NPV of cash flows.
Net present value (NPV)
The present or current value of (discounted) future net cash flows given an interest rate (the discount rate). A positive project NPV normally indicates that the investment should be made unless other projects have higher NPVs.
Return on investment (ROI)
A project’s expected return in percentage terms. ROI is calculated by dividing net benefits (benefits less costs) by costs.
Discount rate
The interest rate used in cash flow analysis to take into account the time value of money. Organizations typically use discount rates between 8% and 16%.
Payback
The breakeven point for an investment. This is the point in time at which net benefits (benefits minus costs) equal initial investment or cost.
Total Economic Impact
Total Economic Impact is a methodology developed by Forrester Research that enhances a company’s technology decision-making processes and assists solution providers in communicating their value proposition to clients. The TEI methodology helps companies demonstrate, justify, and realize the tangible value of business and technology initiatives to both senior management and other key stakeholders.
Endnotes
1 Source: A Reference Guide For Assembling Your Martech Ecosystem, Forrester Research, Inc., September 11, 2025.
2 Total Economic Impact is a methodology developed by Forrester Research that enhances a company’s technology decision-making processes and assists solution providers in communicating their value proposition to clients. The TEI methodology helps companies demonstrate, justify, and realize the tangible value of business and technology initiatives to both senior management and other key stakeholders.
3 Source: Understand Your Audience To Design Better Personalization Initiatives In 2025, Forrester Research, Inc., April 24, 2025.
4 Source: Forrester’s Marketing Survey, 2025.
5 Source: A Reference Guide For Assembling Your Martech Ecosystem, September 11, 2025.
6 Source: Margins by Sector (US), NYU Stern School of Business, January 2026.
Readers should be aware of the following:
This study is commissioned by Braze and delivered by Forrester Consulting. It is not meant to be used as a competitive analysis.
Forrester makes no assumptions as to the potential ROI that other organizations will receive. Forrester strongly advises that readers use their own estimates within the framework provided in the study to determine the appropriateness of an investment in Braze. For any interactive functionality, the intent is for the questions to solicit inputs specific to a prospect’s business. Forrester believes that this analysis is representative of what companies may achieve with Braze based on the inputs provided and any assumptions made. Forrester does not endorse Braze or its offerings. Although great care has been taken to ensure the accuracy and completeness of this model, Braze and Forrester Research are unable to accept any legal responsibility for any actions taken on the basis of the information contained herein. The interactive tool is provided ‘AS IS,’ and Forrester and Braze make no warranties of any kind.
Braze reviewed and provided feedback to Forrester, but Forrester maintains editorial control over the study and its findings and does not accept changes to the study that contradict Forrester’s findings or obscure the meaning of the study.
Braze provided the customer names for the interviews but did not participate in the interviews.
Consulting Team:
Nancy Brooks
Published
April 2026
ABOUT FORRESTER CONSULTING
Forrester provides independent and objective research-based consulting to help leaders deliver key transformation outcomes. Fueled by our customer-obsessed research, Forrester’s seasoned consultants partner with leaders to execute on their priorities using a unique engagement model that tailors to diverse needs and ensures lasting impact. For more information, visit forrester.com/consulting.
© Forrester Research, Inc. All rights reserved. Unauthorized reproduction is strictly prohibited. Information is based on best available resources. Opinions reflect judgment at the time and are subject to change. Forrester®, Technographics®, Forrester Wave, and Total Economic Impact are trademarks of Forrester Research, Inc. All other trademarks are the property of their respective companies.
The Total Economic Impact™ Of Braze
https://mainstayadvisor.com/go/mainstay/gdpr/policy.html