New Technology: The Projected Total Economic Impact™ Of Microsoft 365 Copilot For Sales
Business Benefits And Cost Savings Enabled By Microsoft 365 Copilot For Sales
A Forrester New Technology Projected Total Economic Impact™ Study Commissioned By Microsoft, October 2024
Generative AI (genAI) is transforming how business is conducted across nearly every industry and job function. Microsoft 365 Copilot for Sales is an enterprise-grade, genAI solution that integrates CRM data and is built specifically to help sellers become more effective and efficient, thereby increasing a company’s revenues. Microsoft 365 Copilot for Sales can also reduce sales-related operating costs and improve a sales organization’s culture and employee satisfaction.
Microsoft 365 Copilot for Sales (Copilot for Sales) integrates all of the generative AI capabilities within Microsoft 365 Copilot (formerly Copilot for Microsoft 365), advanced capabilities such as buying-intent analysis, and the richness of data and features included in a company’s CRM system (Microsoft Dynamics 365 Sales or Salesforce Sales Cloud.).1 Taken all together, Copilot for Sales can help sales organizations deliver more revenue by working more deals, increasing deal sizes, improving win rates, reducing sales-related operating costs, and creating happier sales teams. Early adopters are seeing initial benefits across these areas and expect them to increase in the future. These findings are consistent with Forrester research that shows a “generative AI (genAI) revolution is underway” for revenue operations and that 82% of survey respondents have production-ready sales use cases for generative AI or are exploring its use.2
Microsoft commissioned Forrester Consulting to conduct a Total Economic Impact™ (TEI) study and examine the potential return on investment (ROI) enterprises may realize by deploying Copilot for Sales.3 The purpose of this study is to provide readers with a framework to evaluate the potential financial impact of Copilot for Sales on their organizations.
To better understand the benefits, costs, and risks associated with this investment, Forrester interviewed 13 representatives from six organizations with early experience using Copilot for Sales. Forrester also surveyed representatives of 222 companies that are either using Copilot for Sales or considering its use and impacts. For the purposes of this study, Forrester aggregated the interviewees’ experiences and combined the results into a single composite organization. The composite organization is a 12,000-person company that generates annual revenues of $3 billion per year and has extensive presence across Europe and North America with sales operations around the world. Its goal is to deploy genAI to unlock the value of its CRM data and to transform the sales organization in order to increase revenues, make sellers and sales ops teams more efficient and happier, and reduce external spending on sales-related technologies and services.
Projected return on investment (ROI)
125% - 468%
Projected net present value (NPV)
$12.7M - $47.5M
Interviewees and survey respondents said that prior to using Copilot for Sales, their sales organizations lacked easy access to the right information at the right time to effectively work deals, suffered from incomplete and inaccurate CRM data, and had seller and sales ops teams spending too much time on noncustomer-facing activities such as summarizing meeting notes. All of this contributed to sellers’ frustration and burnout, inefficient sales processes, and lost sales.
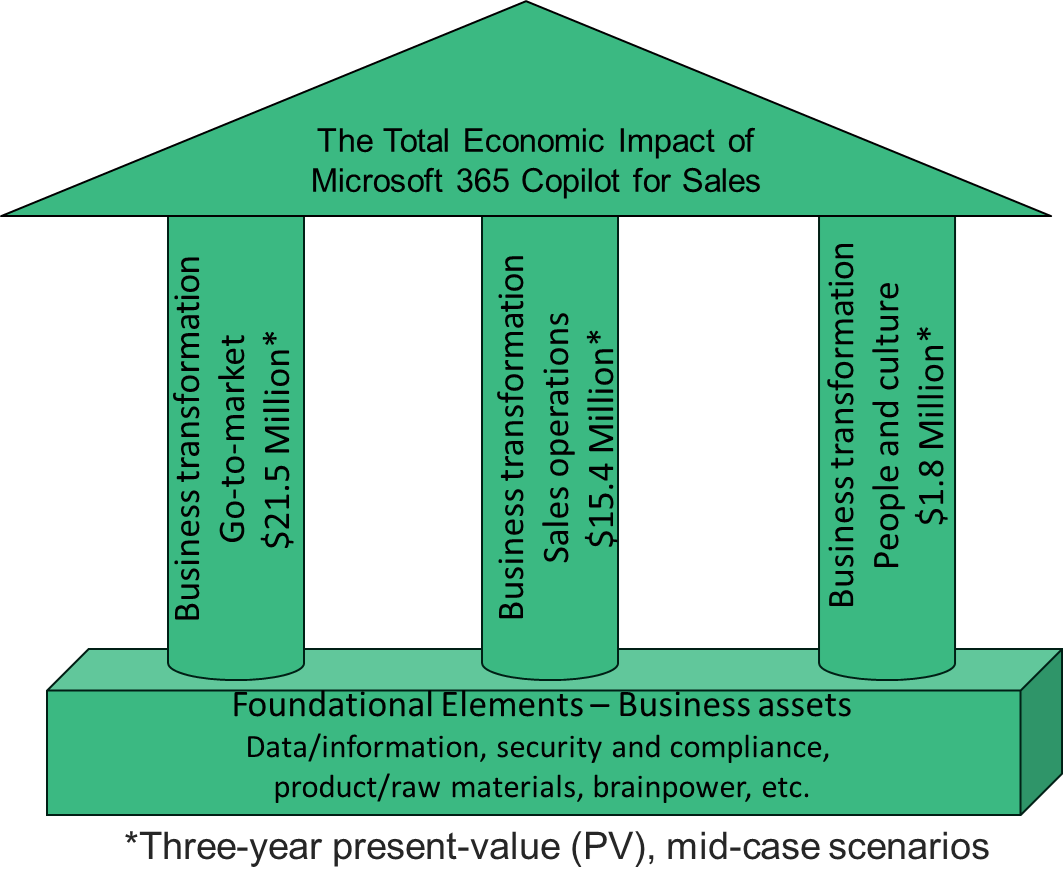
Interviewees and survey respondents said that after the investment in Copilot for Sales, their organizations leveraged internal business assets such as CRM data to achieve business transformation across three pillars: go-to-market, sales operations, and people and culture (see chart below). Collectively, these transformations increased revenues, lowered internal and external sales operation costs, and improved employee experiences that resulted in faster new-hire onboarding and lower employee churn.
Key Findings
Quantified projected benefits. Three-year, risk-adjusted present value (PV) quantified benefits for the composite organization include:
- Up to an 8.2% increase to topline revenues due to go-to-market transformation. Copilot for Sales improves the composite organization’s overall sales results and sales-related KPIs, such as the number of opportunities a seller can work, win rates, and average order value (AOV). This is achieved by making more time available for selling rather than administrative activities, making better use of the right CRM data at the right time for each customer interaction and within the flow of work, and having better insights and analytics. This and all other benefits ramp up over time for the composite organization as the number of users increases and users become more competent in using genAI. Additionally, the low, medium, and high scenarios represent the overall level of transformation achieved with a corresponding increase in benefits realized. After applying an operating margin of 8%, the increase in operating income is projected to be worth between $11.9 million and $34.0 million over three years.
-
Reduction to sales-related costs by enabling
the mix of less-senior and senior sellers to be optimized, decreasing
technology spend by up to 5% and lowering outsourced-services spend by up to
5%. The largest benefit of transforming the
composite’s sales operations is freeing up seller and sales ops time to
focus on higher-value customer-facing activities that result in more
revenues. These time savings come from better collaboration across the sales
organization, more efficient capture of opportunity information, and more
effective interactions with customers by easily integrating CRM data into
every activity and correspondence. In order to avoid double counting,
Forrester did not quantify the composite’s labor savings here because the
time goes towards growing revenues, which is calculated in Benefit A
(Business Transformation: Go-To-Market) .
Copilot for Sales also enables the composite organization to hire a greater proportion of less-senior sellers because it augments their sales skills and makes it easier for sellers to locate and use the best information and resources in customer interactions. By Year 3 of the study, between 15% and 30% of the new hires can be less senior, resulting in cost savings. The composite organization also saves up to 5% by Year 3 on sales-related technology spend on solutions such as sales enablement, bid management, and RFP response systems. Additionally, the composite organization saves up to 5% by Year 3 on outsourced services like data analysis, consulting, and admin support. Taken altogether, these three benefits save the composite organization a projected $9.8 million to $21.0 million over three years. - Reduction to voluntary churn by up to 15% which leads to a people and culture transformation. Copilot for Sales improves the composite organization’s sales culture and seller satisfaction because sellers want to use effective tools and processes. Making their quotas results in making more money and increasing their job satisfaction, and some of the time savings contribute to a better work/life balance. Taken altogether, this increases sales organization employee satisfaction, which reduces employee churn by up to 15% in Year 3. Copilot for Sales also accelerates the composite’s new seller onboarding by up to 15% in Year 3 because the new sellers more quickly learn how to access information and resources to work and close deals. Together, this is worth a projected $1.2 million for the composite and $2.6 million over three years.
Unquantified benefits. Benefits that provide value for the composite organization but are not quantified for this study include:
- Improvements to CRM data-capture rates and quality. Copilot for Sales integrates generative AI with a CRM system and into the flow of work in systems such as Microsoft Teams and Microsoft Outlook. In doing so, Copilot for Sales makes it easier for sellers to update CRM records, and it helps ensure that more information associated with each interaction and opportunity is captured accurately. This contributes to increasing revenues due to the go-to-market transformation, so Forrester does not quantify it in addition to Benefit A to avoid double counting.
- Better security and compliance. Copilot for Sales helps ensure that sensitive and confidential information stays within the business tenant rather than being entered by employees into public genAI tools. This significantly reduces the risk of proprietary data becoming public knowledge. Copilot for Sales also makes it easier to stay compliant with internal policies and any governmental or industry regulations.
Costs. Three-year, risk-adjusted PV costs for the composite organization include:
- Copilot for Sales licenses. The composite organization already has the requisite Microsoft 365 licenses (e.g., Microsoft 365 E5). Its rollout of Copilot for Sales includes Microsoft 365 Copilot and the incremental capabilities included in Copilot for Sales. Therefore, the entire $50 per-user-per-month cost is applied based on the composite organization’s rollout schedule. (If an organization has already rolled out Microsoft 365 Copilot to these users, the $20 incremental cost can be applied instead.) The total cost for the composite organization over the life of the study is $3.6 million.
- Implementation and management effort. Implementation and management efforts include the initial and ongoing technical and change management efforts. The composite organization’s initial effort to implement and integrate Copilot for Sales and to conduct a pilot with 252 users takes three months and requires three full-time equivalent (FTE) resources. Ongoing change management and technical management requires two FTEs, and the composite also requires a modest amount of professional services for the initial implementation of Copilot for Sales and its ongoing management. For the composite organization, the total cost across the life of the study is $1.1 million.
- Training and employee discovery. Forrester research says employee training is a critical component of realizing productivity gains and achieving transformation with genAI, so the composite does not underinvest in this area.4 In addition to the implementation and change management costs (including those for the creation of training content), the composite’s users also spend time in formal training and informal discovery to learn how to use Copilot for Sales and how to write effective prompts. This includes learning how to recognize and control for AI hallucinations (e.g., when inaccurate outputs are generated). Each new user spends 8 hours in formal training, and every new and existing user spends 6 hours each year in informal training and discovery. The composite’s total opportunity cost for time spent on training is $5.5 million over the life of the study.
Forrester modeled a range of projected low-, medium-, and high-impact outcomes based on evaluated risk. This financial analysis projects that the composite organization accrues the following three-year net present value (NPV) for each scenario by enabling Microsoft 365 Copilot for Sales:
- Projected high impact of a $47.5 million NPV and projected ROI of 468%.
- Projected medium impact of a $28.6 million NPV and projected ROI of 282%.
- Projected low impact of a $12.7 million NPV and projected ROI of 125%.
Key Statistics
-

Projected return on investment (PROI):
125% - 468%
-

Projected benefits PV:
$22.8 million - $57.6 million
-

Total costs:
$10.1 million
-

Projected net present value (PNPV):
$12.7 million - $47.5 million
Three-Year Projected Financial Analysis For The Composite Organization
High impact NPV Mid impact NPV Low impact NPV Initial Year 1 Year 2 Year 3 PROI ofNew Technology TEI Framework And Methodology
From the information provided in the interviews and survey, Forrester constructed a New Technology: Projected Total Economic Impact™ (New Tech TEI) framework for those organizations considering an investment in Copilot for Sales.
The objective of the framework is to identify the potential cost, benefit, flexibility, and risk factors that affect the investment decision. Forrester took a multistep approach to evaluate the projected impact that Copilot for Sales can have on an organization.
-
Due Diligence
Interviewed Microsoft stakeholders and Forrester analysts to gather data relative to Copilot for Sales.
-
Early-Implementation Interviews And Survey
Interviewed 13 representatives at six organizations using Copilot for Sales in a pilot or beta stage to obtain data about projected costs, benefits, and risks. Surveyed 222 respondents at organizations either using or considering the use of Copilot for Sales. For more details on these individuals and the organizations they represent, see Appendix B.
-
Composite Organization
Designed a composite organization based on characteristics of the interviewees’ and survey respondents’ organizations.
-
Projected Financial Model Framework
Constructed a projected financial model representative of the interviews and survey using the New Tech TEI methodology and risk-adjusted the financial model based on issues and concerns of the interviewees and survey respondents.
-
Case Study
Employed four fundamental elements of New Tech TEI in modeling the investment’s potential impact: benefits, costs, flexibility, and risks. Given the increasing sophistication of ROI analyses related to IT investments, Forrester’s TEI methodology provides a complete picture of the total economic impact of purchase decisions. Please see Appendix A for additional information on the TEI methodology.
Disclosures
Readers should be aware of the following:
This study is commissioned by Microsoft and delivered by Forrester Consulting. It is not meant to be used as a competitive analysis.
Forrester makes no assumptions as to the potential ROI that other organizations will receive. Forrester strongly advises that readers use their own estimates within the framework provided in the study to determine the appropriateness of an investment in Microsoft 365 Copilot for Sales.
Microsoft reviewed and provided feedback to Forrester, but Forrester maintains editorial control over the study and its findings and does not accept changes to the study that contradict Forrester’s findings or obscure the meaning of the study.
Microsoft provided the customer names for the interviews but did not participate in the interviews.
Consulting Team:
Cassandra Halloran
Jonathan Lipsitz
Nahida Nisa
Drivers leading to the Microsoft 365 Copilot for Sales investment
Key Challenges
Most business leaders are thinking about how genAI can benefit their organization and their individual work. With regard to the sales function, Forrester research from 2024 shows that the priority of 62% of business and technology professionals is to implement AI-enabled/genAI tools for business applications.5
The interviewees and survey respondents shared some of the challenges their sales organizations were facing and that contributed to them applying genAI:
-
Difficulty hiring
and retaining salespeople.
Interviewees said sales organizations struggle to fill open sales positions
and to retain their top sellers. A Forrester survey of B2B sales
professionals from 2023 revealed that the average annual turnover rate in
their sales organization was 19% (10% voluntary and 9%
involuntary).6 Additionally, sellers want to work at places that
provide the best tools and processes to succeed and, in the near future,
genAI will be considered a basic requirement for effective
selling.
The product manager at a financial services organization said, “Copilot will free up time to service and sell more to clients, … which should help with better employee retention in a couple of years.” - Streamlining inefficient sales processes by seamlessly integrating CRM data. Sales leaders said they want to free up their sellers to spend more time with customers to close deals and expand accounts. They also said they see Copilot for Sales as a useful tool to easily leverage and embed CRM data in order to reduce time spent on activities such as searching for information, summarizing meeting notes, creating sales presentations and proposals, writing emails, and updating CRM records.The global sales practice lead at a professional services organization shared the following example: “Getting ready for a call can take 2 to 3 hours per prospect [in] understanding the organization, all the contact details from LinkedIn, the relationship history, and the opportunity, etc. I could see this dropping to 5 minutes.”
-
Reducing the risk of
data leakage from public genAI tools. Interviewees said that without an IT-approved
genAI tool, there is a risk that sellers will paste sensitive information
into publicly available tools. This can lead to data leakage as well as
regulatory violations, resulting in fines and brand damage.
The sales and digital transformation lead at a professional services organization said: “Having the data in our tenant gives us confidence in our security. It is much safer than if our people were using public-facing AI tools.”
Solution Requirements
The interviewees’ organizations and survey respondents searched for a solution that could:
- Improve individual sales metrics (e.g., win rates, sales velocity, etc.), resulting in more revenue.
- Streamline activities to free up salespeople’s time to have more frequent and impactful customer interactions.
- Improve CRM data quality and make it easy to integrate the data into all sales activities.
- Work well with existing Microsoft 365 solutions such as Outlook, Teams, and Word, and the CRM solution.
- Provide the necessary data security.
These requirements are consistent with how Forrester research believes generative AI impacts sales: by increasing rep productivity, enhancing the buyer experience, and revealing hidden account and buyer insights to accelerate sales.7 This research also identifies three potential mistakes to avoid when deploying generative AI to the sales organization. They include: attempting to build your own generative AI platform, hoping technology can replace poor enablement investment and practices, and replacing human sellers instead of augmenting them.
Composite Organization
Based on the interviews and survey, Forrester constructed a TEI framework, a composite company, and an ROI analysis that illustrates the areas financially affected. The composite organization is representative of the 13 interviewees and 222 survey respondents, and it is used to present the aggregate financial analysis in the next section. The composite organization has the following characteristics:
Description of composite. The composite is a global company headquartered in Europe with extensive operations across Europe and North America and sales operations around the globe. The composite organization has $3.0 billion in annual revenues, which is held constant for model simplicity. There are 12,000 total employees including 2,400 sellers and 120 sales ops resources. The composite organization had previously moved to Microsoft 365 and was well down the path of its cloud migration journey. Copilot for Sales is integrated into the CRM system (at the time of writing, Microsoft Dynamics 365 and Salesforce.com Sales Cloud were supported).
Deployment characteristics. The composite organization rolls out Microsoft 365 Copilot for Sales — including the core features included in Microsoft 365 Copilot — to the entire sales and sales ops organization. It rolls out Copilot for Sales to 10% of the sales organization during the initial period as a quick pilot, to 70% of the sales organization in Year 1, and to the remaining users in Year 2.
Quantified benefit data as applied to the composite
Total Projected Benefits
| Projected Benefits | Year 1 | Year 2 | Year 3 | Total | Present Value |
|---|---|---|---|---|---|
| Total projected benefits (low) | $2,583,269 | $9,423,506 | $16,935,652 | $28,942,427 | $22,860,454 |
| Total projected benefits (mid) | $5,263,610 | $17,365,776 | $26,069,426 | $48,698,812 | $38,723,326 |
| Total projected benefits (high) | $10,594,102 | $27,101,417 | $34,072,490 | $71,768,009 | $57,628,034 |
| Note: A 10% discount rate is used to calculate present values. | |||||
The Copilot for Sales benefits, both already realized and anticipated, are shown as part of the three business transformation pillars: go-to-market, sale operations, and people and culture. In addition to the quantified benefit examples, there are also discussions of drivers contributing to the benefits and how the benefits are expected to expand and evolve over time.
Business Transformation: Go-To-Market
Evidence and data. Go-to-market benefits look at the ways Copilot for Sales delivers more revenue. Interviewees said this is achieved by using sellers’ time to be with customers rather than engaging in administrative activities, having better access to the right CRM information at the right time in the sales process to make each interaction more impactful, and making better use of CRM data to generate insights and analytics to progress and close deals. Additionally, all of this happens within the flow of work in applications such as Outlook, Teams, and Word. Taken altogether, interviewees said these improve individual sales metrics and customer satisfaction, which deliver increased revenues. Interviewees shared many examples of how they are achieving early successes and how they expect revenue to grow in the future, including:
- The Sales COO at a financial services company said, “We expect to see an additional 10% improvement in our sales efficiency metrics.” One specific example was conversion rates already increasing from 45% to 65% by using Microsoft 365 Copilot for Sales to refine sales processes and ensure data quality, make pipeline management more visible and forward-looking, and increase real-time reporting via dashboards.
- The same interviewee also said: “If we can save 1 minute per email sent, that will be [$3 million] in increased revenue. Our opportunity cost is $1 per minute, and the revenue-to-cost ratio is 2.5 to 1.”
- The global sales practice lead at a professional services organization shared an example: “Copilot helps us with RFPs. It reads the RFP and tells us if it matches our capabilities, the due dates, and which references to include. Because of Copilot, a 5% increase in revenues is a reasonable, conservative estimate.”
- With regards to capturing CRM information, the innovation lead for a professional services organization said: “It has always been a challenge to get contacts entered into our CRM system. We’ve seen a 10 times increase in contacts being entered in part because of Copilot for Sales.”
-
In terms of working on more accounts and opportunities, a
change manager at a financial services organization said: “There are too
many customers to have a good relationship with all of them. Copilot can
help create more personal relationships with everyone, and customers will
appreciate that.”
The product manager at another financial services organization shared a different way in which more opportunities can be pursued. They said, “For our higher-volume transaction desks that cold call, we have started to see an increase in the volume of leads and interactions. … Our CFO has given us an ambitious goal to free up 30% of everyone’s time to do more client-facing work to increase revenues.” - Several interviewees said one area Copilot for Sales has been very useful is working in one’s non-native languages. The lead solutions architect at a financial services organization said: “People struggle to sell when not using their first language. Copilot makes them feel a lot more comfortable.”
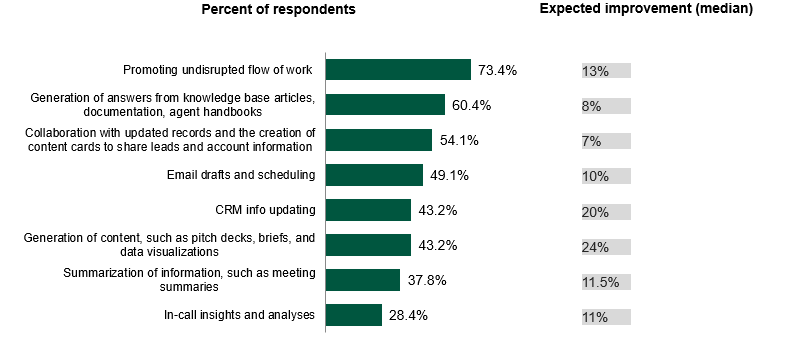
The survey asked about individual sales metrics. The chart below shows the percentage of respondents who expect their organization to realize the benefit during the next 12 months and the expected level of improvement.
Which of the following individual sales employee metrics has/do you expect your sales team to improve as a result of Microsoft 365 Copilot for Sales included in Dynamics 365 Sales licenses?

Base:
222 decision-makers with responsibility or influence over their organizations AI
strategy for the sales organization
Source: A
commissioned study conducted by Forrester Consulting on behalf of Microsoft,
June 2024
Modeling and assumptions. Based on the interviews and survey, Forrester assumes the following for the financial analysis as applied to the composite organization:
- Prior to using Copilot for Sales, each seller worked 125 qualified leads per year, and 10% of those resulted in deals won.
- The composite’s baseline AOV is $100,000, which is held steady other than the effects of Copilot for Sales for model simplicity.
- The maximum improvement in AOV (row A7), the number of qualified deals worked (row A9), and win rates (row A11) are based on what interviewees reported and the survey weighted averages calculated by multiplying the percentage of respondents with the anticipated improvement.
- The extent to which revenue increases for the reasons described above varies based on the level of go-to-market business transformation achieved. For the low scenario, very little transformation is achieved. For the high scenario, the business transformation objectives are fully realized. The middle scenario sits somewhere in between. These three scenarios are used for all quantified benefits. Actions that contribute to achieving a higher level of transformation include providing ample formal training and encouraging self-discovery, collecting and disseminating prompts that users find particularly valuable, and rethinking sales processes to fully leverage the capabilities of Copilot for Sales.
- This benefit ramps up over time for the composite for several reasons, including an increase in Copilot for Sale users, increased familiarity and competence in using Copilot for Sales, and further transformation of sales-related business processes. For the same reasons, a ramp-up is used for all quantified benefits.
- Forrester applied an operating margin of 8.0% to the top-line revenue growth to focus the study on bottom-line financial improvements.
Results. This yields a three-year projected PV ranging from $11.9 million (low) to $34.0 million (high).
Business Transformation: Go-To-Market Module: Range Of Three-Year Cummulative Impact, PV
High projection Mid projection Low projection
Business Transformation: Go-To-Market
| Ref. | Metric | Source | Year 1 | Year 2 | Year 3 | |
|---|---|---|---|---|---|---|
| A1 | Sellers using Copilot for Sales | Composite | 1,680 | 2,400 | 2,400 | |
| A2 | Baseline qualified opportunities a seller works | Composite | 125 | 125 | 125 | |
| A3 | Baseline average win rate | Composite | 10% | 10% | 10% | |
| A4 | Baseline total deals won | A1*A2*A3 | 21,000 | 30,000 | 30,000 | |
| A5 | Baseline AOV | Composite | $100,000 | $100,000 | $100,000 | |
| A6 | Baseline revenues associated with sellers using Copilot for Sales | A4*A5 | $2,100,000,000 | $3,000,000,000 | $3,000,000,000 | |
| A7 | 0.25% | 0.50% | 0.75% | |||
| A7 | Percent increase in AOV | Interviews and survey | 0.50% | 1.00% | 1.25% | |
| A7 | 1.00% | 1.50% | 2.00% | |||
| A8 | $100,250 | $100,500 | $100,750 | |||
| A8 | AOV because of Copilot for Sales | A5*(1+A7) | $100,500 | $101,000 | $101,250 | |
| A8 | $101,000 | $101,500 | $102,000 | |||
| A9 | 0.25% | 0.75% | 1.00% | |||
| A9 | Percent increase in number of qualified deals worked | Interviews and survey | 0.50% | 1.25% | 1.50% | |
| A9 | 1.25% | 1.75% | 2.00% | |||
| A10 | 125.3 | 125.9 | 126.2 | |||
| A10 | Average qualified opportunities a seller works because of Copilot for Sales (rounded) | A2*(1+A9) | 125.6 | 126.5 | 126.8 | |
| A10 | 126.5 | 127.1 | 127.5 | |||
| A11 | 0.25% | 1.00% | 1.75% | |||
| A11 | Percent increase in win rate | Interviews and survey (rounded) | 0.75% | 2.00% | 3.00% | |
| A11 | 1.50% | 3.50% | 4.00% | |||
| A12 | 10.03% | 10.10% | 10.18% | |||
| A12 | Win rate because of Copilot for Sales | A3*(1+A11) | 10.08% | 10.20% | 10.30% | |
| A12 | 10.15% | 10.35% | 10.40% | |||
| A13 | $15,578,357 | $67,075,080 | $104,917,530 | |||
| A13 | Increased revenue because of Copilot for Sales | (A1*A8*A10*A12)-A6 | $36,535,128 | $127,687,200 | $173,677,200 | |
| A13 | $78,648,780 | $204,521,460 | $246,048,000 | |||
| A14 | Operating profit margin | Survey | 8.0% | 8.0% | 8.0% | |
| AtLow | $1,246,269 | $5,366,006 | $8,393,402 | |||
| AtMid | Business transformation: go-to-market | A13*A14 | $2,922,810 | $10,214,976 | $13,894,176 | |
| AtHigh | $6,291,902 | $16,361,717 | $19,683,840 | |||
| Three-year projected total: $15,005,000 to $42,337,000 | Three-year projected present value: $11,873,000 to $34,030,000 | |||||
Business Transformation: Sales Operations
Evidence and data. Interviewees and survey respondents said that Copilot for Sales can make sales-related processes much more efficient, and they shared early examples of how this is being realized. In part, this is achieved by integrating CRM data into processes and interactions and by surfacing AI-generated content in applications that are part of the daily flow of work (e.g., Teams, Outlook, Word). Time savings are achieved through more efficient collaboration between salespeople and across the organization, more efficient capture of account and opportunity information, and more efficient interactions and follow-up with customers.
Sales operations transformation and the associated efficiencies save time for sellers and sales ops teams. This can also result in less external spend on third-party services such as data analytics, professional services, and administrative support. Interviewees and survey respondents also believe that Copilot for Sales can replace other solutions in the sales-technology stack, reducing IT spend in those areas. Interviewees shared many examples of how their organizations are achieving early successes and how they expect to increase efficiencies and reduce costs in the future.
- The product manager at a financial services organization said, “Copilot users are saving 1 hour per day on reading emails.”
- The same interviewee said: “A deal team needs to bring an exec up to speed on each deal. It currently averages out to one day of work per week, and we can cut that time in half.”
- The same interviewee shared that credit-desk review is another process improvement: “Each of our 1,000 sellers needs to go to our credit desk for deal review. This can be a couple of hours up to one day per week. This time required can be reduced by 25%.”
- The innovation lead at a professional services organization said that they can hire less experienced sellers because Copilot for Sales augments a seller’s capabilities and helps them find the right information and resources to create better proposals and customer interactions: “Our cost of selling will go down because we can hire a larger percentage of less experienced sellers. There will also be a reduction in sales-enablement training.”
- The global sales practice lead at another professional organization said, “Our sales ops team is strapped. Because of Copilot, even if we hire another 20 sellers, we won’t have to add two more in sales ops because of the time that will be freed up. They’ll also be able to spend more time on sales strategy rather than sales process compliance.”
- With regard to external spending on other technologies, the sales manager at a telecoms company said, “We spend €750,000 on sales enablement and bid management software. Things like these will eventually be done in generative AI solutions. Most of this expense should go away in two years as our contracts expire.”
- The distribution manager at the same telecom company talked about broader potential cost savings: “Forecast accuracy will improve, so the warehouse will know what to have in stock. That will lower inventory carrying costs and improve our just-in-time operations.”
Survey respondents estimated the potential time savings across many activities shown in the chart below. Across all of the activities, the total time spent per month was 91.5 hours per person, and the weekly savings were 4.0 hours. This equates to 10% of a 40-hour work week.
Which areas of outcomes have you seen/do you expect to benefit most from Microsoft 365 Copilot for Sales and/or Copilot for Sales included in Dynamics 365 Sales licenses?
Base:
222 decision makers with responsibility or influence over their organization's
AI strategy for the sales organization
Source: A
commissioned study conducted by Forrester Consulting on Behalf of Microsoft,
June 2024
The survey also revealed a 6% reduction in sales-related costs and that the average reduction in other IT spend is 5.8%. With regards to reducing third-party services spend, 63.0% of respondents said they expect a reduction in data analysis services, 58.6% expect a reduction in consulting services, 42.3% expect a reduction in administrative support services, and 30.2% expect a reduction in third-party graphic design services.
Modeling and assumptions. Based on the interviews and survey, Forrester assumes the following for the financial analysis as applied to the composite organization:
- The labor costs associated with the time saved by individual sellers and sales ops are not included in the financial model because a significant portion of that time is used to achieve the increased revenues calculated in the go-to-market transformation pillar, so it could result in double counting.
- Nineteen percent of the composite’s sales organization team churns each year (10% voluntary and 9% involuntary). The organization can replace them with an increasing mix of less-senior sellers who cost the organization less. The percentage of positions that can be filled with less-senior people increases over time as the organization improves its use of Copilot for Sales.
- The average reduction in fully burdened cost, including salary, payroll taxes, and benefits for these less-senior sales resources is 40% less than for more experienced resources.
- The reduction in sales-related technology spend includes other AI tools, sales enablement software, bid management software, RFP response software, writing assistant systems, and metatagging systems. By Year 3, the savings are 5%.
- The composite begins to realize the outsource service spend reduction for the services included in the survey in Year 2 because it takes time to ween off of third-party assistance. By Year 3, the savings are 5%.
Results. This yields a three-year projected PV ranging from $9.8 million (low) to $21 million (high).
Business Transformation: Sales Operations Module: Range of Three-Year Cumulative Impact, PV
Business Transformation: Sales Operations
| Ref. | Metric | Source | Year 1 | Year 2 | Year 3 | |
|---|---|---|---|---|---|---|
| B1 | Sellers being replaced (voluntary and involuntary churn) | (10%+9%)*2,400 | 456 | 456 | 456 | |
| B2 | 3.0% | 6.0% | 15.0% | |||
| B2 | Percent of new-hire positions filled with less-senior candidates because of Copilot for Sales | Interviews and survey | 6.0% | 15.0% | 25.0% | |
| B2 | 12.0% | 25.0% | 30.0% | |||
| B3 | Seller fully burdened cost | Composite | $175,000 | $175,000 | $175,000 | |
| B4 | Reduction in seller fully burdened cost for less-senior hires | Interviews and survey | 40% | 40% | 40% | |
| B5 | $957,600 | $1,915,200 | $4,788,000 | |||
| B5 | Reduced seller labor costs because of Copilot for Sales | B1*B2*B3*B4 | $1,915,200 | $4,788,000 | $7,980,000 | |
| B5 | $3,830,400 | $7,980,000 | $9,576,000 | |||
| B6 | Sales-related technology spend before Copilot for Sales | Composite | $30,240,000 | $30,240,000 | $30,240,000 | |
| B7 | Percent reduction in sales-related technology spend | Interviews and survey | 1.0% | 3.0% | 5.0% | |
| B8 | Reduction in sales-related technology spend because of Copilot for Sales | B6*B7 | $302,400 | $907,200 | $1,512,000 | |
| B9 | Sales-related spend on outsourced services before Copilot for Sales | Composite | $25,000,000 | $25,000,000 | $25,000,000 | |
| B10 | Percent reduction in outsourced services spend | Interviews and survey | 0.0% | 3.0% | 5.0% | |
| B11 | Percent reduction in outsourced services spend because of Copilot for Sales | B9*B10 | $0 | $750,000 | $1,250,000 | |
| BtLow | $1,260,000 | $3,572,400 | $7,550,000 | |||
| BtMid | Business transformation: Sales operations | B5+B8+B11 | $2,217,600 | $6,445,200 | $10,742,000 | |
| BtHigh | $4,132,800 | $9,637,200 | $12,338,000 | |||
| Three-year projected total: $12,382,000 to $26,108,000 | Three-year projected present value: $9,770,000 to $20,991,000 | |||||
Business Transformation: People And Culture
Evidence and data. Interviewees and survey respondents said that Copilot for Sales will help improve employee satisfaction as well as the broader sales organization culture. They said this is achieved because better tools and processes make salespeople more likely to join and stay at a company, salespeople are happier when they hit their quotas/make more money, and some of the time savings go towards a better work-life balance. These can all contribute to higher employee retention. Another people and culture benefit is faster new-hire onboarding because they can more easily find CRM information and the colleagues they need to pursue and win deals. Examples of how interviewees and survey respondents saw Copilot for Sales transforming people and culture include the following:
- The global sales practice lead at a professional services organization said: “Most of a seller’s time savings will go to closing more deals, but some will go to looking after their own well-being. This will increase satisfaction and should reduce employee churn. It will also make the entire organization more agile.”
- With regards to new-hire onboarding, the innovation lead at the same organization said: “We hire a lot of management consultants and partners, and it probably takes six months to get them fully ready. We can reduce that by two or three months.”
- The change management consultant at a financial services organization said: “Getting a new hire fully productive takes one to 2.5 years, depending on their prior experience. We should be able to reduce that by 10% with Copilot.”
- More than 60% of the survey respondents said that Copilot for Sales increases employee retention. They estimated retention would improve by 20%.
Modeling and assumptions. Based on the interviews and survey, Forrester assumes the following for the financial analysis as applied to the composite organization:
- Only the 10% voluntary churn rate for the composite’s sellers and sales ops team is included in the analysis. Involuntary churn should decrease, too, as more people achieve their sales quotas and are not let go. Forrester excluded this from the composite modeling because it is too early to estimate that improvement.
- The composite’s average cost to hire a new person is 25% of the fully burdened annual cost. This is lower than what is standard for other roles (35%) because not all of the variable-comp portion needs to be paid out during the onboarding period.
- Prior to using Copilot for Sales, it took the composite 125 days to onboard a new seller or sales ops resource.
- For the reduced time to onboard a new hire, Forrester included only 25% of the potential value (C11) because new sellers do not deliver as much value to an organization as established ones do.
- Of the composite’s total potential increase in productivity/value creation, Forrester included 50% (C12) because not all time savings are used for completing additional work.
Results. This yields a three-year projected PV ranging from $1.2 million (low) to $2.6 million (high).
Business Transformation: People and Culture Module: Range Of Three-Year Cummulative Impact, PV
Business Transformation: People And Culture
| Ref. | Metric | Source | Year 1 | Year 2 | Year 3 | |
|---|---|---|---|---|---|---|
| C1 | Employees using Copilot for Sales | Composite | 1,764 | 2,520 | 2,520 | |
| C2 | Sales organization voluntary churn rate before Copilot for Sales | Forrester research | 10% | 10% | 10% | |
| C3 | Leavers being replaced before Copilot for Sales (rounded) | C1*C2 | 176 | 252 | 252 | |
| C4 | 0.0% | 3.0% | 7.0% | |||
| C4 | Decreased churn rate because of Copilot for Sales | Interviews and survey | 0.0% | 4.0% | 10.0% | |
| C4 | 0.0% | 7.0% | 15.0% | |||
| C5 | Average cost to hire a new salesperson/sales op resource | Composite | $43,750 | $43,750 | $43,750 | |
| C6 | $0 | $330,750 | $771,750 | |||
| C6 | Subtotal: Savings from reduced sales organization churn with Copilot for Sales | C3*C4*C5 | $0 | $441,000 | $1,102,500 | |
| C6 | $0 | $771,750 | $1,653,750 | |||
| C7 | Time to fully onboard a new salesperson prior to Copilot for Sales (days) | Interviews and survey | 125 | 125 | 125 | |
| C8 | 4.0% | 6.0% | 8.0% | |||
| C8 | Acceleration in new-hire onboarding because of Copilot for Sales | Interviews and survey | 7.0% | 10.0% | 12.0% | |
| C8 | 9.0% | 12.0% | 15.0% | |||
| C9 | 5 | 7 | 10 | |||
| C9 | Time saved per new hire onboarded because of Copilot for Sales (days) (rounded) | C7*C8 | 8 | 12 | 15 | |
| C9 | 11 | 15 | 18 | |||
| C10 | Average fully burdened daily cost for sales organization | TEI standard | $700 | $700 | $700 | |
| C11 | Productivity of new hire during ramp | Composite | 25% | 25% | 25% | |
| C12 | Time recaptured | Composite | 50% | 50% | 50% | |
| C13 | $77,000 | $154,350 | $220,500 | |||
| C13 | Subtotal: Acceleration of new hire onboarding | C3*C9*C10*C11*C12 | $123,200 | $264,600 | $330,750 | |
| C13 | $169,400 | $330,750 | $396,900 | |||
| CtLow | $77,000 | $485,100 | $992,250 | |||
| CtMid | Business transformation: People and culture | C6+C13 | $123,200 | $705,600 | $1,433,250 | |
| CtHigh | $169,400 | $1,102,500 | $2,050,650 | |||
| Three-year projected total: $1,554,000 to $3,322,000 | Three-year projected present value: $1,216,000 to $2,605,000 | |||||
Unquantified Benefits
Interviewees mentioned the following additional benefits that their organizations experienced but were not able to quantify:
- Improved CRM data-capture rates and quality. Improved CRM contributes to the other benefits, so Forrester did not quantify it here to avoid double counting. Each interviewee said poor CRM capture rates and quality were a large problem for their organization, and survey respondents expect a 20% improvement in CRM information being updated. The product manager at a financial services organization said: “Data quality will improve, and we will make better decisions faster. That will translate into better customer targeting.”
- Better security and compliance. Interviewees said one of the main reasons their organizations were interested in Copilot for Sales was to provide a secure and compliant genAI tool so that employees do not use publicly available tools and leak confidential CRM data. Interviewees also said they appreciate Microsoft’s commitment to the secure and responsible use of AI. The product manager at a financial services organization said: “There is less of a chance of data leakage. … Copilot will also help with compliance.” Nearly 77% of survey respondents said IT/data security would improve, and 51.4% said it would help with industry and governmental regulation compliance.
Flexibility
The value of flexibility is unique to each customer. There are multiple scenarios in which a customer might implement Copilot for Sales and later realize additional use cases and business opportunities, including:
- Making use of advanced CRM integration capabilities and future roadmap features. At the time of writing, interviewees’ organizations were early in their journeys to use the more advanced CRM integration capabilities within Copilot for Sales. The future growth in the model is partly based on what interviewees expect their organizations to achieve as they more fully adopt the more advanced features, but there is potential for additional benefits. Some of the advanced CRM features that generated the most interest are buying intent analysis, real-time call insights, and recommended CRM updates. Beyond the existing capabilities, interviewees said their organizations are also keen to take advantage of future capabilities on the Microsoft roadmap, both announced and unannounced. The product manager at a financial services organization said: “The rate of innovation is huge. There are updates almost every week, and it is good to be a part of that journey early on.”
- Using Copilot Studio for extensibility and customization. In addition to all of the benefits that come from Copilot for Sales off the shelf, organizations can also use Copilot Studio to extend the genAI capabilities into other systems and to create customized experiences. A quick-win use case is creating chatbots, which was a capability within Power Virtual Agents, the predecessor to Copilot Studios. The product manager at a financial services organization shared the example of using Copilot Studio to create a chatbot. They said, “The feedback was positive, and people did not know they were talking to a machine.”
Flexibility would also be quantified when evaluated as part of a specific project (described in more detail in Appendix A).
Quantified cost data as applied to the composite
Total Costs
| Ref. | Cost | Initial | Year 1 | Year 2 | Year 3 | Total | Present Value |
|---|---|---|---|---|---|---|---|
| Dtr | License cost of Copilot for Sales | $39,690 | $1,111,320 | $1,587,600 | $1,587,600 | $4,326,210 | $3,554,834 |
| Etr | Implementation and management effort | $207,000 | $350,750 | $350,750 | $350,750 | $1,259,250 | $1,079,263 |
| Ftr | Training and employee discovery | $195,058 | $2,231,460 | $2,307,533 | $1,833,542 | $6,567,593 | $5,508,277 |
| Total costs (risk-adjusted) | $441,748 | $3,693,530 | $4,245,883 | $3,771,892 | $12,153,053 | $10,142,374 | |
License Cost Of Copilot For Sales
Evidence and data. Interviewees noted that Microsoft 365 Copilot required users to first have either a Microsoft 365 E3 or an E5 license with Microsoft Entra ID (previously called Azure Active Directory) access. Copilot for Sales includes Microsoft 365 Copilot as part of the $50 per-user-per-month license. If an organization has already rolled out Microsoft 365 Copilot to the sales organization, the incremental cost for Copilot for Sales is $20 per user per month.
With regard to rolling out Copilot for Sales to the sales organization, the interviewees said their organizations aimed to roll it out in a timeframe that is as short as reasonable for all sellers and sales ops teams. This is a faster and fuller rollout compared to Microsoft 365 Copilot rollouts to all knowledge workers because sales is viewed as a functional area that can benefit greatly from genAI.
Modeling and assumptions. Based on the interviews and survey, Forrester assumes the following for the financial analysis as applied to the composite organization:
- All Copilot for Sales users in the composite organization already have either a Microsoft 365 E5 or E3 license, and those associated costs and benefits are not included in this analysis.
- The composite organization conducts a short pilot as part of the initial deployment. It then rolls out Copilot for Sales to all sellers and sales ops teams in the first two years.
- The composite’s license cost of Copilot for Sales, including the Microsoft 365 Copilot component, is $50 per user per month.
Risks. Results may not be representative of all experiences, and the cost will vary among organizations depending on the following factors:
- Employees who do not have Microsoft 365 E5 or E3 will have additional costs and benefits associated with those licenses.
- License costs for Copilot for Sales are not guaranteed to stay $50 per user per month indefinitely.
Results. To account for these risks, Forrester adjusted this cost upward by 5%, yielding a three-year, risk-adjusted total PV (discounted at 10%) of $3.6 million.
License Cost Of Copilot For Sales
| Ref. | Metric | Source | Initial | Year 1 | Year 2 | Year 3 |
|---|---|---|---|---|---|---|
| D1 | Employees using Copilot for Sales | Composite | 252 | 1,764 | 2,520 | 2,520 |
| D2 | License cost of Copilot for Sales per user per month | Microsoft | $50 | $50 | $50 | $50 |
| D3 | Months | Composite | 3 | 12 | 12 | 12 |
| Dt | License cost of Copilot for Sales | D1*D2*D3 | $37,800 | $1,058,400 | $1,512,000 | $1,512,000 |
| Risk adjustment | ↑5% | |||||
| Dtr | License cost of Copilot for Sales (risk-adjusted) | $39,690 | $1,111,320 | $1,587,600 | $1,587,600 | |
| Three-year total: $4,326,000 | Three-year present value: $3,554,000 | |||||
Implementation And Management Effort
Evidence and data. Interviewees noted that Copilot for Sales is a transformational technology that changes how their sales organizations work and think. Transformation of this nature required a reimagining of processes, resources, and strategies. There was also effort around CRM data management: cleaning up internal data, ensuring that data permissions were set correctly, and potentially excluding certain data from Copilot for Sales indexing. If a broader rollout of Microsoft 365 Copilot to other functional areas is being undertaken concurrently, it will come with a separate set of costs and benefits, which are not included in this study.
- Interviewees said their organizations’ initial implementations of Copilot for Sales typically started with a short pilot covering around 10% of users. After that, the rollouts took anywhere from one month to four months. The survey revealed an average initial deployment of three months.
- Implementation teams included representatives from IT and sales operations for the technology component, sales leadership and individual contributors for testing, and legal and security resources to ensure that everything was implemented in compliance with company policies. The learning and development team created training content during this period. Team sizes ranged from two to 4.5 FTEs.
Modeling and assumptions. Based on the interviews and survey, Forrester assumes the following for the financial analysis as applied to the composite organization:
- The composite’s initial deployment lasts three months and requires three FTEs. This includes a two-week pilot, technical and change management work, and creating the training content.
- The composite spends $75,000 on initial professional services to assist with the technical deployment work and some training content creation.
- Ongoing technology and change management work requires two internal FTEs and a small amount of ongoing professional services.
Risks. Results may not be representative of all experiences, and the cost will vary among organizations depending on the following factors:
- The size of the initial deployment.
- Any additional integrations beyond the CRM system and applications included in Microsoft 365.
- The extent of data cleanup required.
Results. To account for these risks, Forrester adjusted this cost upward by 15%, yielding a three-year, risk-adjusted total PV of 1.1 million.
Implementation And Management Effort
| Ref. | Metric | Source | Initial | Year 1 | Year 2 | Year 3 |
|---|---|---|---|---|---|---|
| E1 | FTEs involved in technology and change management | Interviews and survey | 3.0 | 2.0 | 2.0 | 2.0 |
| E2 | Months | Interviews and survey | 3 | 12 | 12 | 12 |
| E3 | Average annual fully burdened cost for an IT worker | TEI standard | $11,667 | $11,667 | $11,667 | $11,667 |
| E4 | Professional services cost | Composite | $75,000 | $25,000 | $25,000 | $25,000 |
| Et | Implementation and management effort | E1*E2*E3+E4 | $180,000 | $305,000 | $305,000 | $305,000 |
| Risk adjustment | ↑15% | |||||
| Etr | Implementation and management effort (risk-adjusted) | $207,000 | $350,750 | $350,750 | $350,750 | |
| Three-year total: $1,259,000 | Three-year present value: $1,079,000 | |||||
Training And Employee Discovery
Evidence and data. Each interviewee said there needs to be a mix of formal training and time for an individual’s discovery and playing with Copilot for Sales. One of the largest areas of training is good prompt-writing. Interviewees shared many examples of how they provide training, including:
- Having trainers attend sale-teams’ regularly scheduled meetings in order to increase attendance at training sessions rather than inviting salespeople to an additional meeting.
- Hosting a 1-hour introduction to Copilot for Sales training session followed by a five-question quiz to be sure they paid attention.
- Having lunch and learn sessions.
- Creating videos and other easy-to-consume tutorials as part of a microtraining approach.
- Holding weekly online sessions in which users can compare notes on what works well and share prompts they have used that worked very well.
- Having online repositories that make it easy for users to find prompts for different use cases.
Modeling and assumptions. Based on the interviews and survey, Forrester assumes the following for the financial analysis as applied to the composite organization:
- Each new Copilot for Sales user for the composite receives 8 hours of formal training.
- Both new and existing users spend 6 hours each year on discovery and informal training.
- The opportunity cost is the time sellers and sales ops spend on training rather than completing their regular responsibilities.
Risks. Results may not be representative of all experiences, and the cost will vary among organizations depending on the following factors:
- Certain user groups may require more training based on their general comfort level with technology.
- Forrester research shows that training is a critical success factor and that companies should spend more time on training than many currently do.8
Results. To account for these risks, Forrester adjusted this cost upward by 15%, yielding a three-year, risk-adjusted total PV of $5.5 million.
Training And Employee Discovery
| Ref. | Metric | Source | Initial | Year 1 | Year 2 | Year 3 |
|---|---|---|---|---|---|---|
| F1 | Copilot for Sales users | Composite | 252 | 1,764 | 2,520 | 2,520 |
| F2 | New users | Composite | 252 | 1,560 | 1,091 | 479 |
| F3 | Formal training time for a new user (hours) | Composite | 8 | 8 | 8 | 8 |
| F4 | Total formal training time for a new user (hours) | F2*F3 | 2,016 | 12,479 | 8,729 | 3,830 |
| F5 | Ongoing discovery/informal training time per user (hours) | Composite | 6 | 6 | 6 | |
| F6 | Total ongoing discovery/informal training time (hours) | F1*F5 | 10,584 | 15,120 | 15,120 | |
| F7 | Hourly fully burdened cost for a user | TEI standard | $84.13 | $84.13 | $84.13 | $84.13 |
| Ft | Training and employee discovery | (F4+F6)*F7 | $169,615 | $1,940,400 | $2,006,550 | $1,594,385 |
| Risk adjustment | ↑15% | |||||
| Ftr | Training and employee discovery (risk-adjusted) | $195,058 | $2,231,460 | $2,307,533 | $1,833,542 | |
| Three-year total: $6,567,000 | Three-year present value: $5,508,000 | |||||
Consolidated Three-Year, Risk-Adjusted Metrics
Three-year Projected Financial Analysis For The Composite Organization
-

The financial results calculated in the Benefits and Costs sections can be used to determine the PROI and projected NPV for the composite organization’s investment. Forrester assumes a yearly discount rate of 10% for this analysis.
These risk-adjusted PROI and projected NPV values are determined by applying risk-adjustment factors to the unadjusted results in each Benefit and Cost section.
Cash Flow Analysis (Risk-Adjusted)
| Initial | Year 1 | Year 2 | Year 3 | Total | Present Value | |
|---|---|---|---|---|---|---|
| Total costs | ($441,748) | ($3,693,530) | ($4,245,883) | ($3,771,892) | ($12,153,053) | ($10,142,374) |
| Total benefits (low) | $0 | $2,583,269 | $9,423,506 | $16,935,652 | $28,942,427 | $22,860,454 |
| Total benefits (mid) | $0 | $5,263,610 | $17,365,776 | $26,069,426 | $48,698,812 | $38,723,326 |
| Total benefits (high) | $0 | $10,594,102 | $27,101,417 | $34,072,490 | $71,768,009 | $57,628,034 |
| Net benefits (low) | ($441,748) | ($1,110,261) | $5,177,624 | $13,163,760 | $16,789,375 | $12,718,080 |
| Net benefits (mid) | ($441,748) | $1,570,080 | $13,119,894 | $22,297,534 | $36,545,760 | $28,580,952 |
| Net benefits (high) | ($441,748) | $6,900,572 | $22,855,534 | $30,300,598 | $59,614,956 | $47,485,660 |
| PROI (low) | 125% | |||||
| PROI (mid) | 282% | |||||
| PROI (high) | 468% | |||||
Appendix A: New Technology: Projected Total Economic Impact
New Technology: Projected Total Economic Impact (New Tech TEI) is a methodology developed by Forrester Research that enhances a company’s technology decision-making processes and assists vendors in communicating the value proposition of their products and services to clients. The New Tech TEI methodology helps companies demonstrate and justify the projected tangible value of IT initiatives to both senior management and other key business stakeholders.
Total Economic Impact Approach
-
Projected Benefits represent the projected value to be delivered to the business by the product. The New Tech TEI methodology places equal weight on the measure of projected benefits and the measure of projected costs, allowing for a full examination of the effect of the technology on the entire organization.
-

Projected Costs consider all expenses necessary to deliver the proposed value, or benefits, of the product. The projected cost category within New Tech TEI captures incremental costs over the existing environment for ongoing costs associated with the solution.
-
Flexibility represents the strategic value that can be obtained for some future additional investment building on top of the initial investment already made. Having the ability to capture that benefit has a PV that can be estimated.
-

Risks measure the uncertainty of benefit and cost estimates given: 1) the likelihood that estimates will meet original projections and 2) the likelihood that estimates will be tracked over time. TEI risk factors are based on “triangular distribution.”
The initial investment column contains costs incurred at “time 0” or at the beginning of Year 1 that are not discounted. All other cash flows are discounted using the discount rate at the end of the year. PV calculations are calculated for each total cost and benefit estimate. NPV calculations in the summary tables are the sum of the initial investment and the discounted cash flows in each year. Sums and present value calculations of the Total Benefits, Total Costs, and Cash Flow tables may not exactly add up, as some rounding may occur.
Appendix B: InteRview And Survey Demographics
Interviews
| Role | Industry | Region | Number of employees and sellers |
|---|---|---|---|
Product manager |
Financial services |
EMEA |
Employees:
4,000 Sellers: 1,000 |
| Sales
manager Distribution manager |
Telecoms |
EMEA |
Employees:
10,000 Sellers: 300 |
Sales transformation and strategic accounts |
Professional services |
Global |
Employees:
4,000 Sellers: 1,000 |
| Innovation
lead Global sales practice lead |
Professional services |
Global |
Employees:
18,000 Sellers: 700 |
| Lead solutions
architect Sales COO Change manager |
Financial services |
EMEA |
Employees: 46,000 Sellers: 3,500 |
| Director
of IT CRM GTM manager Lead engineer Technical product manager |
Information technology |
Global |
Employees: 23,000 Sellers: 6,000 |
Survey Demographics
Industry
Financial services and/or insurance Technology and/or technology services Government Healthcare Manufacturing and materials Legal services Retail Energy, utilities, and/or waste management Media and/or leisure Advertising and/or marketing Telecommunications services Consumer services[CONTENT]
Security Agriculture, food, and/or beverage Consumer product goods and/or manufacturing Business or professional services Education Transportation and logistics Electronics Chemicals and/or metals Construction Travel and hospitality NonprofitEmployee Count
20,000 or more employees 500 to 999 employess 1,000 to 4,999 employess 5,000 to 19,999 employess
Region
APAC North America EMEALA
Base:
222 decision-makers with responsibility or influence over their sales
organization's AI strategy for the sales
organization
Note: Percentages
may not total 100 because of rounding.
Source: A
commissioned study conducted by Forrester Consulting on behalf of Microsoft,
June 2024
Appendix c: Supplemental Material
Related Forrester Research
Planning Guide 2024: Revenue Operations, Forrester Research, Inc. July 31, 2023.
Build Your Business Case For Microsoft 365 Copilot, Forrester Research, Inc., October 24, 2023.
Using The Forrester Sales Productivity Benchmark To Maximize Reps’ Productivity, Forrester Research, Inc. January 1, 2024.
The State Of Generative AI, 2024, Forrester Research, Inc., January 26, 2024.
Prepare Your Entire Workforce For AI Now, Forrester Research, Inc., March 26, 2024.
It Takes A Village To Make AI Copilots Successful, Forrester Research, Inc. September 3, 2024.
Appendix D: Endnotes
1 At time of writing, the integrated CRM systems included Microsoft Dynamics 365 and Salesforce.
2 Source: Budget Planning Guide 2025: Revenue Operations, Forrester Research, Inc., August 1, 2024.
3 Total Economic Impact is a methodology developed by Forrester Research that enhances a company’s technology decision-making processes and assists vendors in communicating the value proposition of their products and services to clients. The TEI methodology helps companies demonstrate, justify, and realize the tangible value of IT initiatives to both senior management and other key business stakeholders.
4 Source: How To Drive Employee Productivity With Generative AI, Forrester Research, Inc., March 11, 2024.
5 Source: CRM Trends That Matter In 2024, Forrester Research, Inc., July 10, 2024.
6 Source: Forrester’s B2B Sales Survey, 2023. Base 425 global B2B sales professionals who are sales managers or sales leaders.
7 Source: Generative AI: What It Means For B2B Sales, Forrester Research, Inc. September 14, 2023.
8 Source: How To Drive Employee Productivity With Generative AI, Forrester Research, Inc., March 11, 2024.